نویسنده: AliBina

  • Rule of 72 – Useful code

    Rule of 72 – Useful code


    Ever heard of the Rule of 72? It’s a classic finance shortcut that tells you how many years it takes for an investment to double at a given interest rate—without reaching for a calculator! Pretty much, if you want to understand when you are going to double your money, that are growing with 7% per year, then simply divide 72 by 7 and see the approximate answer. It works like that and it is approximately ok, for values between 5 and 10%.

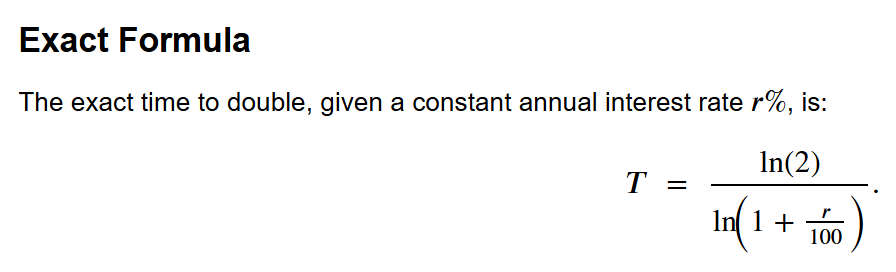
    For all other values, the formula looks like this:

    ln(2) is approximately 0.693. Hence, it is 0.693 divided by ln(1+tiny percentage).

    With Python the formula looks like this:

    If you want to see how exact the formula is, then a good comparison vs the exact value looks like this:

    The execution of the code from above like this:

    The YT video, explaining the code and is here:

    https://www.youtube.com/watch?v=BURstTrQWkA

    The GitHub code is here: https://github.com/Vitosh/Python_personal/tree/master/YouTube/023_Python-Rule-of-72

    A nice picture from Polovrak Peak, Bulgaria

    Enjoy!


    Source link

  • Rules of 114 and 144 – Useful code


    The Rule of 114 is a quick way to estimate how long it will take to triple your money with compound interest.  The idea is simple: divide 114 by the annual interest rate (in %), and you will get an approximate answer in years.

    • If you earn 10% annually, the time to triple your money is approximately: 114/10=11.4 years.

    Similarly, the Rule of 144 works for quadrupling your money. Divide 144 by the annual interest rate to estimate the time.

    • At 10% annual growth, the time to quadruple your money is: 144/10=14.4 years

    Why Do These Rules Work?

    These rules are approximations based on the exponential nature of compound interest. While they are not perfectly accurate for all rates, they are great for quick mental math, especially for interest rates in the 5–15% range. While the rules are convenient, always use the exact formula when accuracy matters!

    Exact Formulas?

    For precise calculations, use the exact formula based on logarithms:

    • To triple your money:
    • To quadruple your money:

    These rules for 4x or 3x can be summarized with the following python formula:

    Generally, these rules are explained a bit into more details in the video, below:

    https://www.youtube.com/watch?v=iDcPdcKi-oI

    The GitHub repository is here: https://github.com/Vitosh/Python_personal/tree/master/YouTube/024_Python-Rule-of-114

    Enjoy it! 🙂


    Source link

  • Trigonometric Functions – Sine – Useful code


    import numpy as np

    import matplotlib.pyplot as plt

    import matplotlib.animation as animation


    # Generate unit circle points

    theta = np.linspace(0, 2 * np.pi, 1000)

    x_circle = np.cos(theta)

    y_circle = np.sin(theta)


    # Initialize figure

    fig, ax = plt.subplots(figsize=(8, 8))

    ax.plot(x_circle, y_circle, ‘b-‘, label=“Unit Circle”)  # Unit circle

    ax.axhline(0, color=“gray”, linestyle=“dotted”)

    ax.axvline(0, color=“gray”, linestyle=“dotted”)


    # Add dynamic triangle components

    triangle_line, = ax.plot([], [], ‘r-‘, linewidth=2, label=“Triangle Sides”)

    point, = ax.plot([], [], ‘ro’)  # Moving point on the circle


    # Text for dynamic values

    dynamic_text = ax.text(0.03, 0.03, “”, fontsize=12, color=“black”, ha=“left”, transform=ax.transAxes)


    # Set up axis limits and labels

    ax.set_xlim(1.2, 1.2)

    ax.set_ylim(1.2, 1.2)

    ax.set_title(“Sine as a Triangle on the Unit Circle”, fontsize=14)

    ax.set_xlabel(“cos(θ)”, fontsize=12)

    ax.set_ylabel(“sin(θ)”, fontsize=12)

    ax.legend(loc=“upper left”)


    # Animation update function

    def update(frame):

        angle = theta[frame]

        x_point = np.cos(angle)

        y_point = np.sin(angle)

        degrees = np.degrees(angle) % 360  # Convert radians to degrees


        # Update triangle

        triangle_line.set_data([0, x_point, x_point, 0], [0, y_point, 0, 0])


        # Update point on the circle

        point.set_data([x_point], [y_point])  # Fixed this line to avoid the warning


        # Update text for angle, opposite side length, and sin(θ)

        dynamic_text.set_text(f“Angle: {degrees:.1f}°\nOpposite Side Length: {y_point:.2f}\nsin(θ): {y_point:.2f}”)

        return triangle_line, point, dynamic_text


    # Create animation

    ani = animation.FuncAnimation(fig, update, frames=len(theta), interval=20, blit=True)

    plt.show()


    Source link

  • Sine and Cosine – A friendly guide to the unit circle


    Welcome to the world of sine and cosine! These two functions are the backbone of trigonometry, and they’re much simpler than they seem. In this article, we will explore the unit circle, the home of sine and cosine, and learn


    Source link

  • VBA – Automated Pivot Filtering – Useful code


    Sub FilterPivotTableBasedOnSelectedTeams()


        Dim pt As PivotTable

        Dim selectedItemsRange As Range

        Dim myCell As Range

        Dim fieldName As String

        Dim lastRowSelected As Long

        Dim pi As PivotItem

        Dim firstItemSet As Boolean


        Set pt = ThisWorkbook.Worksheets(“PivotTable2”).PivotTables(“PivotTable2”)

        lastRowSelected = LastRow(tblTemp.Name, 1)

        Set selectedItemsRange = tblTemp.Range(“A1:A” & lastRowSelected)

        fieldName = “Team”

        pt.PivotFields(fieldName).ClearAllFilters


        Dim itemsTotal As Long

        itemsTotal = pt.PivotFields(fieldName).PivotItems.Count


        For Each pi In pt.PivotFields(fieldName).PivotItems

            If Not IsInRange(pi.Name, selectedItemsRange) Then

                itemsTotal = itemsTotal 1

                If itemsTotal = 0 Then

                    Err.Raise 222, Description:=“No value in the pivot!”

                    Exit Sub

                End If


                pi.Visible = False

            End If

        Next pi


    End Sub


    Function IsInRange(myValue As String, myRange As Range) As Boolean


        Dim myCell As Range

        IsInRange = False

        For Each myCell In myRange.Cells

            If myCell.value = myValue Then

                IsInRange = True

                Exit Function

            End If

        Next myCell


    End Function


    Public Function LastRow(wsName As String, Optional columnToCheck As Long = 1) As Long


        Dim ws As Worksheet

        Set ws = ThisWorkbook.Worksheets(wsName)

        LastRow = ws.Cells(ws.Rows.Count, columnToCheck).End(xlUp).Row


    End Function


    Source link

  • Automate Stock Analysis with Python and Yfinance: Generate Excel Reports


    In this article, we will explore how to analyze stocks using Python and Excel. We will fetch historical data for three popular stocks—Realty Income (O), McDonald’s (MCD), and Johnson & Johnson (JNJ) — calculate returns, factor in dividends, and visualize


    Source link

  • Python – Data Wrangling with Excel and Pandas – Useful code

    Python – Data Wrangling with Excel and Pandas – Useful code


    Data wrangling with Excel and Pandas is actually quite useful tool in the belt of any Excel professional, financial professional, data analyst or a developer. Really, everyonecan benefit from the well defined libraries that ease people’s lifes. These are the libraries used:

    Additionally, a function for making a unique Excel name is used:

    An example of the video, where Jupyter Notebook is used.

    In the YT video below, the following 8 points are discussed:

    # Trick 1 – Simple reading of worksheet from Excel workbook

    # Trick 2 – Combine Reports

    # Trick 3 – Fix Missing Values

    # Trick 4 – Formatting the exported Excel file

    # Trick 5 – Merging Excel Files

    # Trick 6 – Smart Filtering

    # Trick 7 – Mergining Tables

    # Trick 8 – Export Dataframe to Excel

    The whole code with the Excel files is available in GitHub here.

    https://www.youtube.com/watch?v=SXXc4WySZS4

    Enjoy it!


    Source link

  • Python – Monte Carlo Simulation – Useful code

    Python – Monte Carlo Simulation – Useful code


    Python can be used for various tasks. One of these is Monte Carlo simulation for future stock analysis. In the video below this is exactly what is happening. 🙂

    10K simulations in 30 buckets for KO look like that.

    Instead of explaining the video and its code (available also in GitHub), I will concentrate on why it is better to use log returns than simple returns in stock analysis. Which is actually part of the video as well. Below are the 3 main reasons:

    1. Time-Additivity

    Log returns sum over time, making multi-period calculations effortless. A 10% gain followed by a 10% loss doesn’t cancel out with simple returns—but it nearly does with logs.

    2. Symmetry Matters

    A +10% and -10% return aren’t true inverses in simple terms. Logs fix this, ensuring consistent math for gains and losses.

    3. Better for Modeling

    Log returns follow a near-normal distribution, crucial for statistical models like Monte Carlo simulations.

    When to Use Simple Returns?

    Code Highlights


    Source link

  • Python – Reading Financial Data From Internet – Useful code

    Python – Reading Financial Data From Internet – Useful code


    Reading financial data from the internet is sometimes challenging. In this short article with two python snippets, I will show how to read it from Wikipedia and from and from API, delivering in JSON format:

    This is how the financial json data from the api looks like.

    Reading the data from the API is actually not tough, if you have experience reading JSON, with nested lists. If not, simply try with trial and error and eventually you will succeed:

    With the reading from wikipedia, it is actually even easier – the site works flawlessly with pandas, and if you count the tables correctly, you would get what you want:

    You might want to combine both sources, just in case:

    The YouTube video for this article is here:
    https://www.youtube.com/watch?v=Uj95BgimHa8
    The GitHub code is there – GitHub

    Enjoy it! 🙂


    Source link

  • Python – Simple Stock Analysis with yfinance – Useful code

    Python – Simple Stock Analysis with yfinance – Useful code


    Sometimes, the graphs of stocks are useful. Sometimes these are not. In general, do your own research, none of this is financial advice.

    And while doing that, if you want to analyze stocks with just a few lines of python, this article might help? This simple yet powerful script helps you spot potential buy and sell opportunities for Apple (AAPL) using two classic technical indicators: moving averages and RSI.

    Understanding the Strategy

    1. SMA Crossover: The Trend Following Signal

    The script first calculates two Simple Moving Averages (SMA):

    The crossover strategy is simple:

    This works because moving averages smooth out price noise, helping identify the overall trend direction.

    2. RSI: The Overbought/Oversold Indicator

    The Relative Strength Index (RSI) measures whether a stock is overbought or oversold:

    By combining SMA crossovers (trend confirmation) and RSI extremes (timing), we get stronger signals.

    This plot is generated with less than 40 lines of python code

    The code looks like that:

    The code above, but in way more details is explained in the YT video below:

    https://www.youtube.com/watch?v=m0ayASmrZmE

    And it is available in GitHub as well.


    Source link