Knowing the Assembly Version of the API you’ve deployed on an environment may be helpful for many reasons. We’re gonna see why, how to retrieve it, and how to expose it with Endpoint Routing (bye-bye Controllers and Actions!)
Table of Contents
Just a second! 🫷 If you are here, it means that you are a software developer.
So, you know that storage, networking, and domain management have a cost .
If you want to support this blog, please ensure that you have disabled the adblocker for this site. I configured Google AdSense to show as few ADS as possible – I don’t want to bother you with lots of ads, but I still need to add some to pay for the resources for my site.
Thank you for your understanding. – Davide
Sometimes it can be useful to show the version of the running Assembly in one .NET Core API endpoint: for example, when you want to know which version of your code is running in an environment, or to expose a simple endpoint that acts as a “minimal” health check.
In this article, we’re going to see how to retrieve the assembly version at runtime using C#, then we will expose it under the root endpoint of a .NET Core API without creating an API Controller, and lastly we’ll see how to set the Assembly version with Visual Studio.
How to get Assembly version
To get the Assembly version, everything we need is this snippet:
The first step is to get the info about the running assembly:
Assembly assembly = Assembly.GetEntryAssembly();
The Assembly class is part of the System.Reflection namespace, so you have to declare the corresponding using statement.
The AssemblyInformationalVersionAttribute attribute comes from the same namespace, and contains some info for the assembly manifest. You can get that info with the second line of the snippet:
Next, we need to expose that value using .NET Core API.
Since we’re exposing only that value, we might not want to create a new Controller with a single Action: in this case, endpoint routing is the best choice!
In the Startup.cs file, under the Configure method, we can define how the HTTP request pipeline is configured.
By default, for ASP.NET Core APIs, you’ll see a section that allows the engine to map the Controllers to the endpoints:
In this section, we can configure some other endpoints.
The easiest way is to map a single path to an endpoint and specify the returned content. We can do it by using the MapGet method, which accepts a string for the path pattern and an async Delegate for the execution:
In this way, we will receive the message Hi there every time we call the root of our API (because of the first parameter, /), and it happens only when we use the GET HTTP Verb, because of the MapGet method.
Putting all together
Now that we have all in place, we can join the two parts and return the Assembly version on the root of our API.
You could just return the string as it is returned from the versionAttribute.InformationalVersion property we’ve seen before. Or you could wrap it into an object.
If you don’t want to specify a class for it, you can use an ExpandoObject instance and create new properties on the fly. Then, you have to serialize it into a string, and return it in the HTTP Response:
endpoints.MapGet("/", async context =>
{
// get assembly version Assembly assembly = Assembly.GetEntryAssembly();
AssemblyInformationalVersionAttribute versionAttribute = assembly.GetCustomAttribute<AssemblyInformationalVersionAttribute>();
string assemblyVersion = versionAttribute.InformationalVersion;
// create the dynamic objectdynamic result = new ExpandoObject();
result.version = assemblyVersion;
// serialize the objectstring versionAsText = JsonSerializer.Serialize(result);
// return it as a stringawait context.Response.WriteAsync(versionAsText);
});
That’s it!
Of course, if you want only the version as a string without the dynamic object, you can simplify the MapGet method in this way:
endpoints.MapGet("/", async context =>
{
    var version = Assembly.GetEntryAssembly().GetCustomAttribute<AssemblyInformationalVersionAttribute>().InformationalVersion;
    await context.Response.WriteAsync(version);
});
But, for this example, let’s stay with the full object.
Let’s try it: update Assembly version and retrieve it from API
After tidying up the code, the UseEndpoints section will have this form:
WithAssemblyVersionOnRoot is an extension method I created to wrap that logic and make the UseEndpoints method cleaner. If you want to learn how to create extension methods with C#, and what are some gotchas, head to this article!
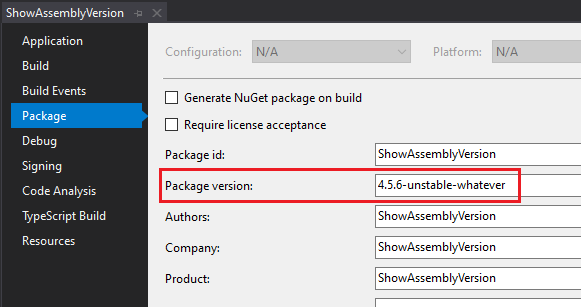
To see the result, open Visual Studio, select the API project and click alt + Enter to navigate to the Project properties. Here, under the Package tag, define the version in the Package version section.
In this screen, you can set the value of the package that will be built.
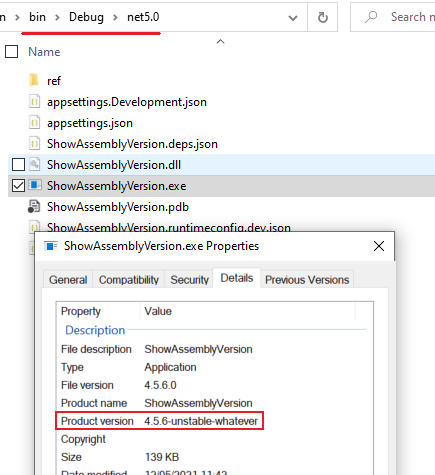
To double-check that the version is correct, head to the bin folder and locate the exe related to your project: right-click on it, go to properties and to the details tab. Here you can see the details of that exe:
Noticed the Product version? That’s exactly what we’ve set up on Visual Studio.
So, now it’s time to run the application.
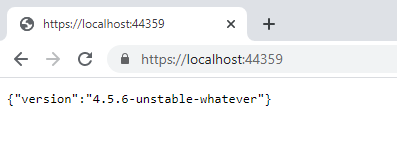
Get back to Visual Studio, run the application, and navigate to the root of the API.
Finally, we can enjoy the result!
Quite simple, isn’t it?
Wrapping up
In this article, we’ve seen how to expose on a specific route the version of the assembly running at a specified URL.
This is useful to help you understand which version is currently running in an environment without accessing the CD pipelines to see which version has been deployed.
Also, you can use this information as a kind of health check, since the data exposed are static and do not depend on any input or database status: the simplest match for getting info about the readiness of your application.
What other info would you add to the exposed object? Let me know in the comment section 👇
If your application is exposed on the Web, I guess that you get some values from the HTTP Requests, don’t you?
Table of Contents
Just a second! 🫷 If you are here, it means that you are a software developer.
So, you know that storage, networking, and domain management have a cost .
If you want to support this blog, please ensure that you have disabled the adblocker for this site. I configured Google AdSense to show as few ADS as possible – I don’t want to bother you with lots of ads, but I still need to add some to pay for the resources for my site.
Thank you for your understanding. – Davide
If you are building an application that is exposed on the Web, you will probably need to read some data from the current HTTP Request or set some values on the HTTP Response.
In a .NET API, all the info related to both HTTP Request and HTTP Response is stored in a global object called HttpContext. How can you access it?
In this article, we will learn how to get rid of the old HttpContext.Current and what we can do to write more testable code.
Why not HttpContext directly
Years ago, we used to access the HttpContext directly in our code.
For example, if we had to access the Cookies collection, we used to do
var cookies = HttpContext.Current.Request.Cookies;
It worked, right. But this approach has a big problem: it makes our tests hard to set up.
In fact, we were using a static instance that added a direct dependency between the client class and the HttpContext.
That’s why the .NET team has decided to abstract the retrieval of that class: we now need to use IHttpContextAccessor.
Add IHttpContextAccessor
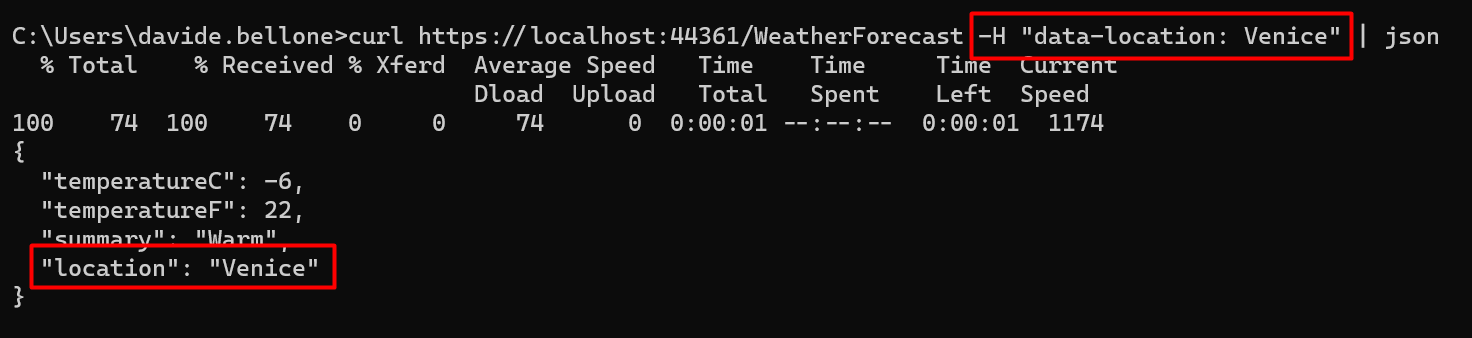
Now, I have this .NET project that exposes an endpoint, /WeatherForecast, that returns the current weather for a particular city, whose name is stored in the HTTP Header “data-location”.
The real calculation (well, real… everything’s fake, here 😅) is done by the WeatherService. In particular, by the GetCurrentWeather method.
public WeatherForecast GetCurrentWeather()
{
string currentLocation = GetLocationFromContext();
var rng = new Random();
returnnew WeatherForecast
{
TemperatureC = rng.Next(-20, 55),
Summary = Summaries[rng.Next(Summaries.Length)],
Location = currentLocation
};
}
We have to retrieve the current location.
As we said, we cannot anymore rely on the old HttpContext.Current.Request.
Instead, we need to inject IHttpContextAccessor in the constructor, and use it to access the Request object:
public WeatherService(IHttpContextAccessor httpContextAccessor)
{
    _httpContextAccessor = httpContextAccessor;
}
Once we have the instance of IHttpContextAccessor, we can use it to retrieve the info from the current HttpContext headers:
string currentLocation = "";

if (_httpContextAccessor.HttpContext.Request.Headers.TryGetValue("data-location", out StringValues locationHeaders) && locationHeaders.Any())
{
    currentLocation = locationHeaders.First();
}

return currentLocation;
Easy, right? We’re almost done.
Configure Startup class
If you run the application in this way, you will not be able to access the current HTTP request.
That’s because we haven’t specified that we want to add IHttpContextAccessor as a service in our application.
To do that, we have to update the ConfigureServices class by adding this instruction:
services.AddHttpContextAccessor();
Which comes from the Microsoft.Extensions.DependencyInjection namespace.
Now we can run the project!
If we call the endpoint specifying a City in the data-location header, we will see its value in the returned WeatherForecast object, in the Location field:
Further improvements
Is it enough?
If we use it this way, every class that needs to access the HTTP Context will have tests quite difficult to set up, because you will need to mock several objects.
In fact, for mocking HttpContext.Request.Headers, we need to create mocks for HttpContext, for Request, and for Headers.
This makes our tests harder to write and understand.
So, my suggestion is to wrap the HttpContext access in a separate class and expose only the methods you actually need.
For instance, you could wrap the access to HTTP Request Headers in the GetValueFromRequestHeader of an IHttpContextWrapper service:
In this way, you will be able to write better tests both for the HttpContextWrapper class, by focusing on the building of the HttpRequest, and for the WeatherService class, so that you can write tests without worrying about setting up complex structures just for retrieving a value.
But pay attention to the dependency lifescope! HTTP Requests info live within – guess what? – their HTTP Request. So, when defining the dependencies in the Startup class, remember to inject the IHttpContextWrapper as Transient or, even better, as Scoped. If you don’t remember the difference, I got you covered here!
Wrapping up
In this article, we’ve learned that you can access the current HTTP request by using IHttpContextAccessor. Of course, you can use it to update the Response too, for instance by adding an HTTP Header.
In a microservices architecture, an API Gateway hides your real endpoints. We will create one using Azure API Management
Table of Contents
Just a second! 🫷 If you are here, it means that you are a software developer.
So, you know that storage, networking, and domain management have a cost .
If you want to support this blog, please ensure that you have disabled the adblocker for this site. I configured Google AdSense to show as few ADS as possible – I don’t want to bother you with lots of ads, but I still need to add some to pay for the resources for my site.
Thank you for your understanding. – Davide
If you’re building an application that exposes several services you might not want to expose them on different hosts. Consumers will have a hard time configuring their application with all the different hostnames, and you will be forced to maintain the same URLs even if you need to move to other platforms or, for instance, you want to transform a REST endpoint into an Azure Function.
In this case, you should mask the real endpoints beneath a facade: maybe… an API Gateway? 🙂
In this article, we will learn how to configure Azure API Management (from now on: APIM) service to create an API Gateway and “hide” our real services.
Demo: publish .NET API services and locate the OpenAPI definition
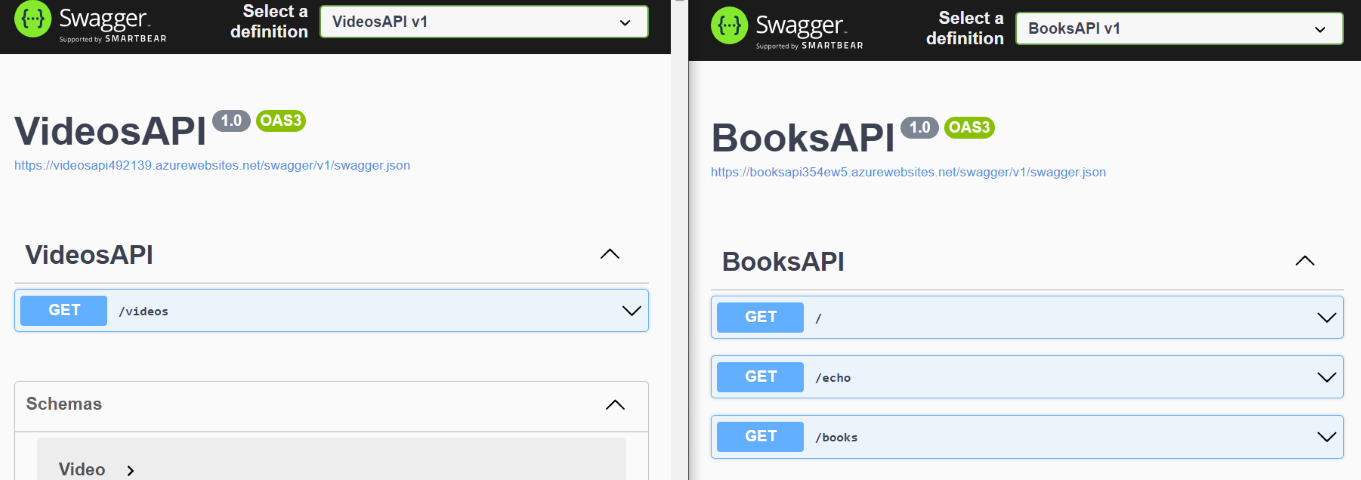
For the sake of this article, we will work with 2 API services: BooksService and VideosService.
They are both .NET 6 APIs, deployed on Azure using GitHub Actions (using the steps I described in a previous article).
Both services expose their Swagger pages and a bunch of endpoints that we will gonna hide behind Azure APIM.
How to create Azure API Management (APIM) Service from Azure Portal
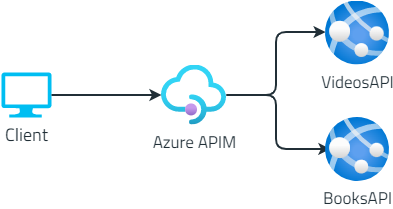
Now, we want to hide their real endpoints. The clients will then only know about the existence of the API Gateway, and not of the two separate API services:
It’s time to create our APIM resource.👷♂️
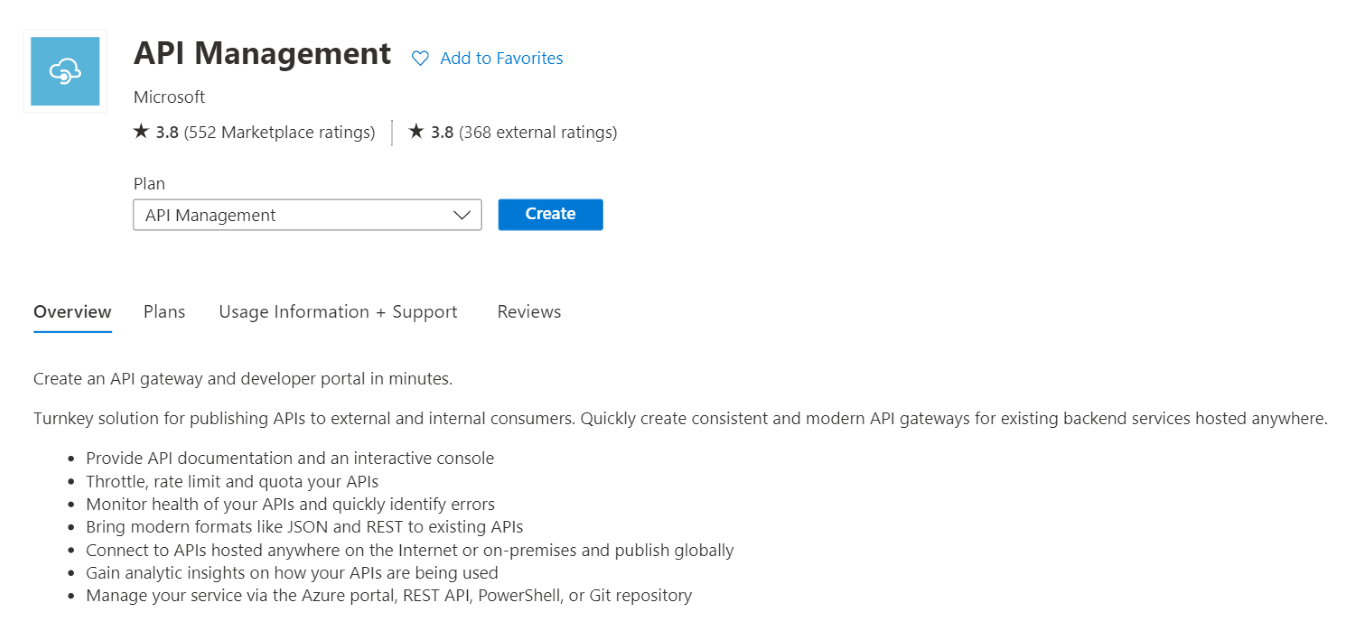
Head to the Azure Portal, and create a new API Management instance. I suggest reading the short overview of the functionalities provided by Azure API Management services as listed in the screenshot below.
The wizard will ask you for some info, such as the resource name, the region, and an email used to send communications (honestly speaking, I still haven’t figured out why they’re asking for your email).
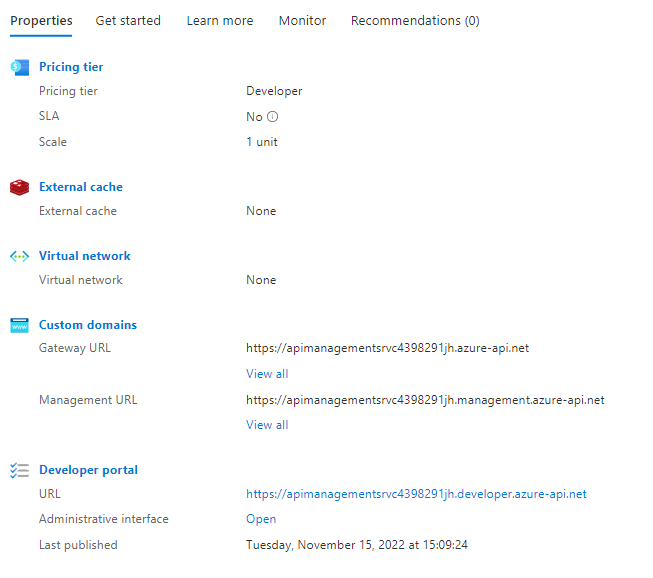
Fill in all the fields, pick your preferred pricing tier (mine is Developer: it doesn’t have an SLA and is quite cheap), and then proceed with the service creation.
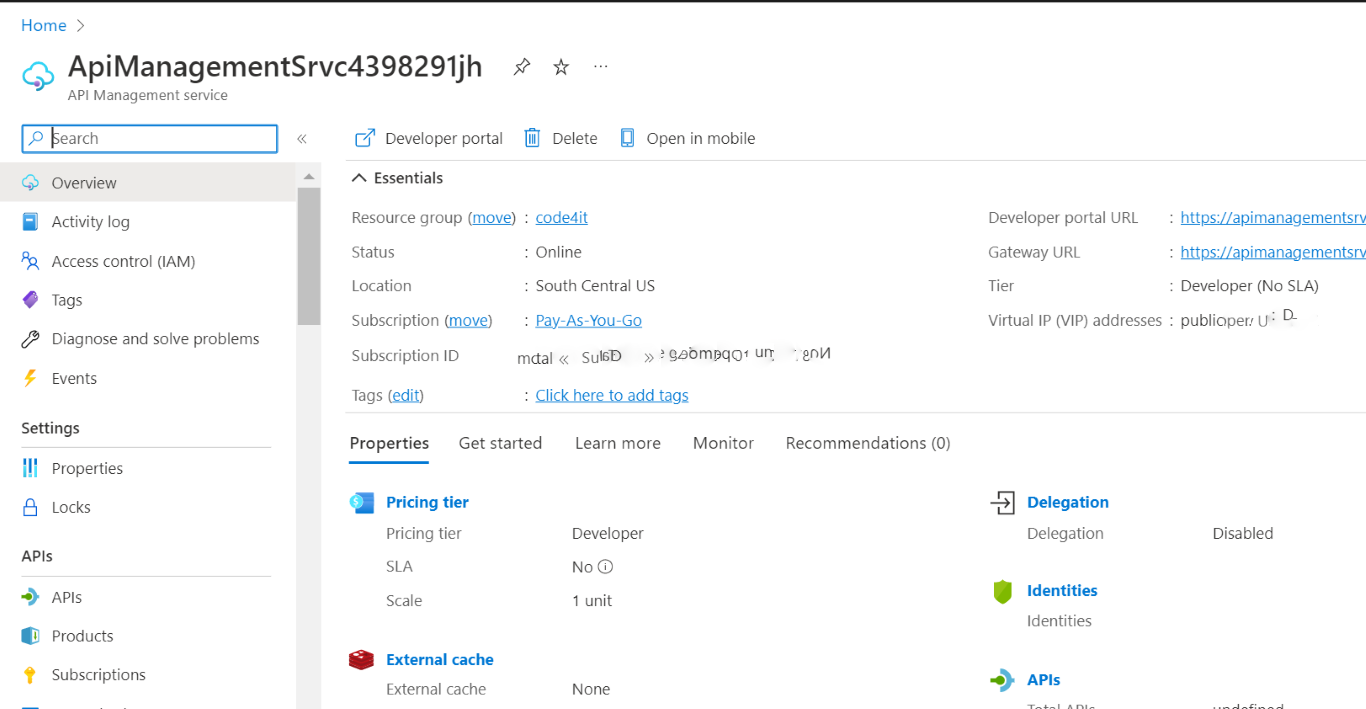
After several minutes (it took 50 minutes – fifty!💢 – to scaffold my instance), you will have your instance ready to be used.
We are now ready to add our APIs and expose them to our clients.
How to add APIs to Azure API Management using Swagger definition (OpenAPI)
As we’ve seen in a previous article, Swagger creates a JSON file that describes the operations available in your APIs, as well as the object structures accepted as input and returned as output.
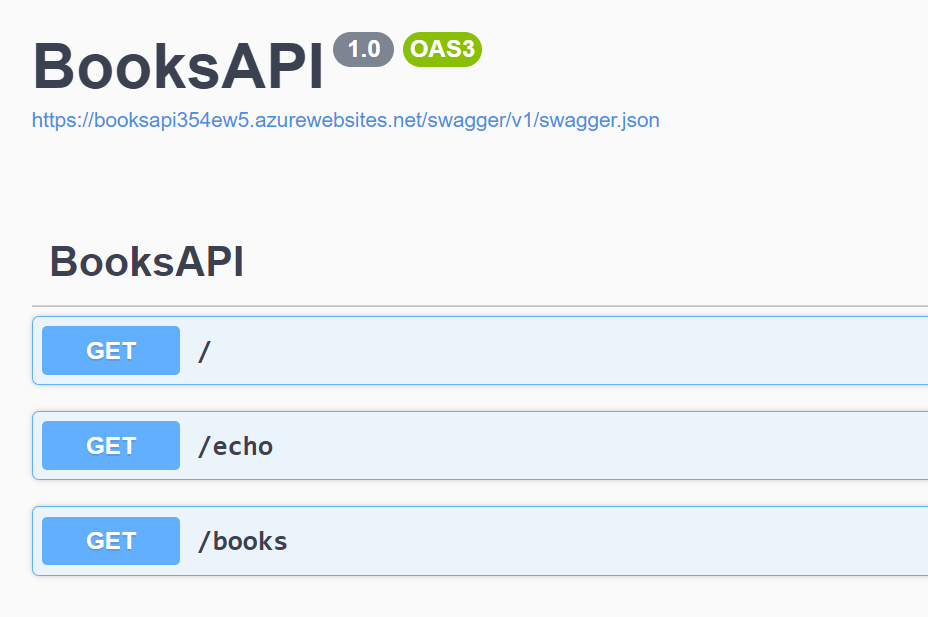
Let me use as an example the Books API: once that API project is deployed on the cloud (it’s not mandatory to use Azure: it will work the same using other cloud vendors), you will see the Swagger UI and the related JSON definition.
We have 3 endpoints, /, /echo, and /books; those endpoints are described in the swagger.json file linked in the Swagger page; put that link aside: we will use it soon.
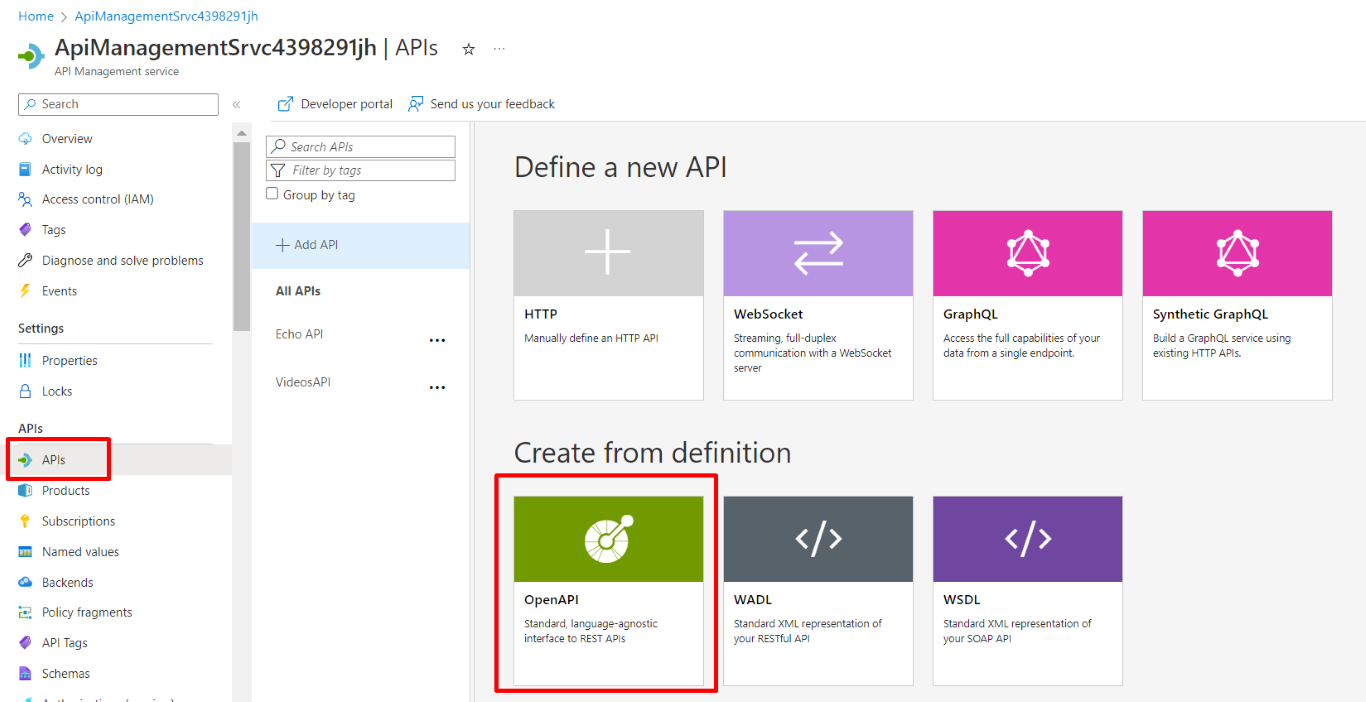
Finally, we can add our Books APIs to our Azure Management API Service! Head to the resource on Azure, locate the APIs menu item on the left panel, and create a new API definition using OpenAPI (which is the standard used by Swagger to create its UI).
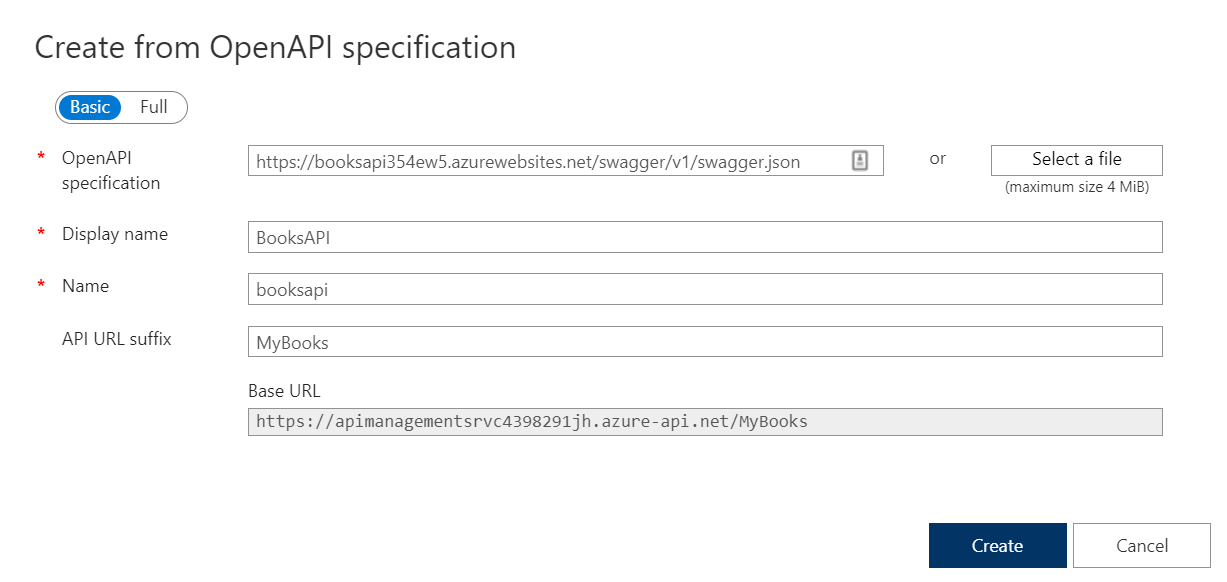
You will see a form that allows you to create new resources from OpenAPI specifications.
Paste here the link to the swagger.json file you located before, populate the required fields and, if you want, add a prefix to identify these endpoints: I choose MyBooks.
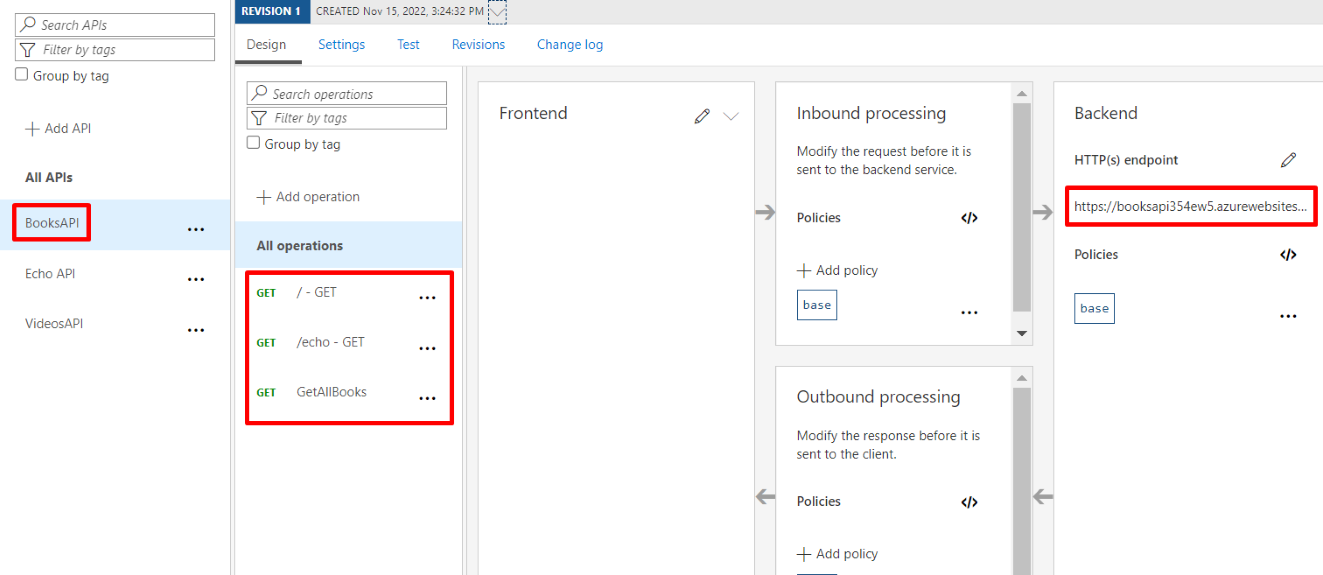
You will then see your APIs appear in the panel shown below. It is composed of different parts:
The list of services exposed. In the screenshot below, BooksAPI, Echo API, and VideosAPI;
The list of endpoints exposed for each service: here, BooksAPI exposes endpoints at /, /echo, and /books;
A list of policies that are applied to the inbound requests before hitting the real endpoint;
The real endpoint used when calling the facade exposed by APIM;
A list of policies applied to the outbound requests after the origin has processed the requests.
For now, we will ignore both Inbound and Outbound processing, as they will be the topic of a future article.
Consuming APIs exposed on the API Gateway
We’re ready to go! Head back to the Azure API Management service dashboard and locate the URL of the API Gateway under Custom domains > Gateway URL.
This will be the root URL that our clients will use.
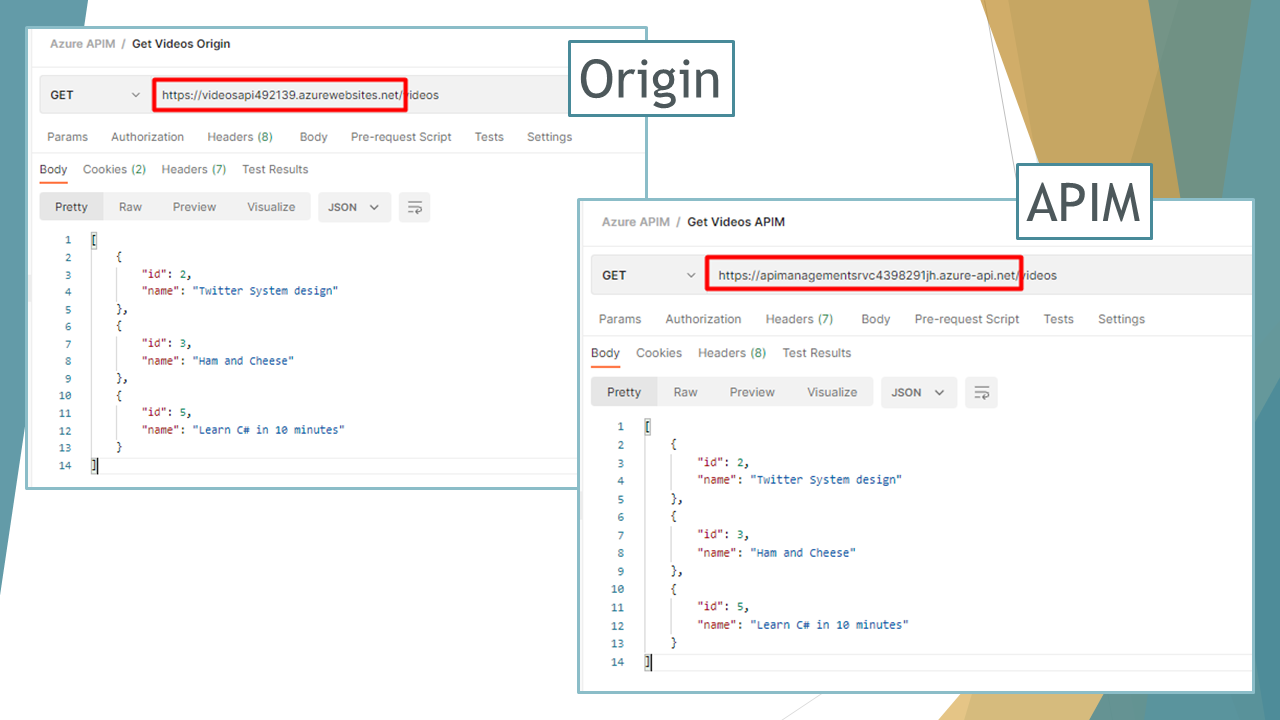
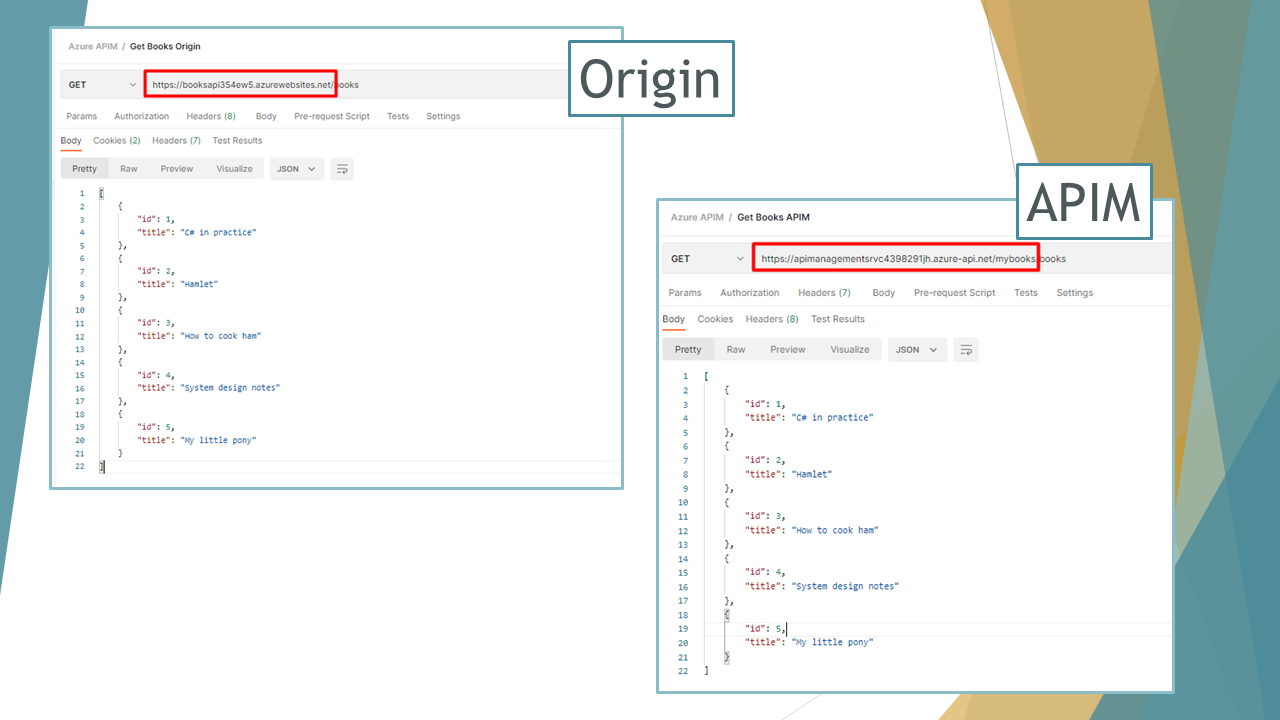
We can then access Books API and Videos API both on the Origin and the Gateway (we’re doing it just for demonstrating that things are working; clients will only use the APIs exposed by the API Gateway).
The Videos API maintains the exact same structure, mapping the endpoints as they are defined in Origin.
On the contrary, to access the Books APIs we have to access the /mybooks path (because we defined it a few steps ago when we imported the BooksAPI from OpenAPI definition: it’s the API Url Suffix field), as shown below:
Further readings
As usual, a bunch of interesting readings 📚
In this article, we’ve only scratched the surface of Azure API Management. There’s way lot – and you can read about it on the Microsoft Docs website:
To integrate Azure APIM, we used two simple dotNET 6 Web APIs deployed on Azure. If you wanna know how to set up GitHub Actions to build and deploy dotNET APIs, I recently published an article on that topic.
This can be just the beginning of a long journey; APIM allows you to highly customize your API Gateway by defining API access by user role, creating API documentation using custom templates and themes, and a lot of different stuff.
Integration Tests are incredibly useful: a few Integration Tests are often more useful than lots of Unit Tests. Let’s learn some advanced capabilities of WebApplicationFactory.
Table of Contents
Just a second! 🫷 If you are here, it means that you are a software developer.
So, you know that storage, networking, and domain management have a cost .
If you want to support this blog, please ensure that you have disabled the adblocker for this site. I configured Google AdSense to show as few ADS as possible – I don’t want to bother you with lots of ads, but I still need to add some to pay for the resources for my site.
Thank you for your understanding. – Davide
In a previous article, we learned a quick way to create Integration Tests for ASP.NET API by using WebApplicationFactory. That was a nice introductory article. But now we will delve into more complex topics and examples.
In my opinion, a few Integration Tests and just the necessary number of Unit tests are better than hundreds of Unit Tests and no Integration Tests at all. In general, the Testing Diamond should be preferred over the Testing Pyramid (well, in most cases).
In this article, we are going to create advanced Integration Tests by defining custom application settings, customizing dependencies to be used only during tests, defining custom logging, and performing complex operations in our tests.
For the sake of this article, I created a sample API application that exposes one single endpoint whose purpose is to retrieve some info about the URL passed in the query string. For example,
GET /SocialPostLink?uri=https%3A%2F%2Ftwitter.com%2FBelloneDavide%2Fstatus%2F1682305491785973760
For completeness, instanceName is a value coming from the appsettings.json file, while info is an object that holds some info about the social post URL passed as input.
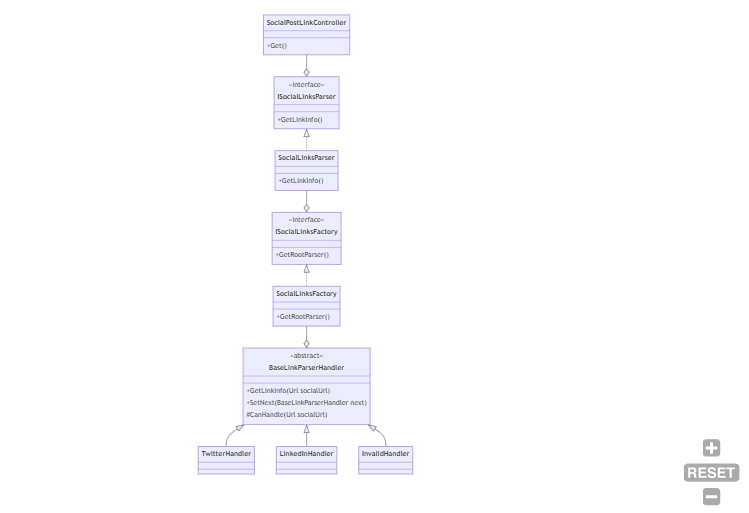
Internally, the code is using the Chain of Responsibility pattern: there is a handler that “knows” if it can handle a specific URL; if so, it just elaborates the input; otherwise, it calls the next handler.
There is also a Factory that builds the chain, and finally, a Service that instantiates the Factory and then resolves the dependencies.
As you can see, this solution can become complex. We could run lots of Unit Tests to validate that the Chain of Responsibility works as expected. We can even write a Unit Tests suite for the Factory.
But, at the end of the day, we don’t really care about the internal structure of the project: as long as it works as expected, we could even use a huge switch block (clearly, with all the consequences of this choice). So, let’s write some Integration Tests.
How to create a custom WebApplicationFactory in .NET
When creating Integration Tests for .NET APIs you have to instantiate a new instance of WebApplicationFactory, a class coming from the Microsoft.AspNetCore.Mvc.Testing NuGet Package.
Since we are going to define it once and reuse it across all the tests, let’s create a new class that extends WebApplicationFactory, and add some custom behavior to it.
Let’s focus on the Program class: as you can see, the WebApplicationFactory class requires an entry point. Generally speaking, it’s the Program class of our application.
If you hover on WebApplicationFactory<Program> and hit CTRL+. on Visual Studio, the autocomplete proposes two alternatives: one is the Program class defined in your APIs, while the other one is the Program class defined in Microsoft.VisualStudio.TestPlatform.TestHost. Choose the one for your API application! The WebApplicationFactory class will then instantiate your API following the instructions defined in your Program class, thus resolving all the dependencies and configurations as if you were running your application locally.
What to do if you don’t have the Program class? If you use top-level statements, you don’t have the Program class, because it’s “implicit”. So you cannot reference the whole class. Unless… You have to create a new partial class named Program, and leave it empty: this way, you have a class name that can be used to reference the API definition:
publicpartialclassProgram { }
Here you can override some definitions of the WebHost to be created by calling ConfigureWebHost:
How to use WebApplicationFactory in your NUnit tests
It’s time to start working on some real Integration Tests!
As we said before, we have only one HTTP endpoint, defined like this:
privatereadonly ISocialLinkParser _parser;
privatereadonly ILogger<SocialPostLinkController> _logger;
privatereadonly IConfiguration _config;
public SocialPostLinkController(ISocialLinkParser parser, ILogger<SocialPostLinkController> logger, IConfiguration config)
{
_parser = parser;
_logger = logger;
_config = config;
}
[HttpGet]public IActionResult Get([FromQuery] string uri)
{
_logger.LogInformation("Received uri {Uri}", uri);
if (Uri.TryCreate(uri, new UriCreationOptions { }, out Uri _uri))
{
var linkInfo = _parser.GetLinkInfo(_uri);
_logger.LogInformation("Uri {Uri} is of type {Type}", uri, linkInfo.SocialNetworkName);
var instance = new Instance
{
InstanceName = _config.GetValue<string>("InstanceName"),
Info = linkInfo
};
return Ok(instance);
}
else {
_logger.LogWarning("Uri {Uri} is not a valid Uri", uri);
return BadRequest();
}
}
We have 2 flows to validate:
If the input URI is valid, the HTTP Status code should be 200;
If the input URI is invalid, the HTTP Status code should be 400;
We could simply write Unit Tests for this purpose, but let me write Integration Tests instead.
First of all, we have to create a test class and create a new instance of IntegrationTestWebApplicationFactory. Then, we will create a new HttpClient every time a test is run that will automatically include all the services and configurations defined in the API application.
As you can see, the test class implements IDisposable so that we can call Dispose() on the IntegrationTestWebApplicationFactory instance.
From now on, we can use the _client instance to work with the in-memory instance of the API.
One of the best parts of it is that, since it’s an in-memory instance, we can even debug our API application. When you create a test and put a breakpoint in the production code, you can hit it and see the actual values as if you were running the application in a browser.
Now that we have the instance of HttpClient, we can create two tests to ensure that the two cases we defined before are valid. If the input string is a valid URI, return 200:
[Test]publicasync Task Should_ReturnHttp200_When_UrlIsValid()
{
string inputUrl = "https://twitter.com/BelloneDavide/status/1682305491785973760";
var result = await _client.GetAsync($"SocialPostLink?uri={inputUrl}");
Assert.That(result.StatusCode, Is.EqualTo(HttpStatusCode.OK));
}
Otherwise, return Bad Request:
[Test]publicasync Task Should_ReturnBadRequest_When_UrlIsNotValid()
{
string inputUrl = "invalid-url";
var result = await _client.GetAsync($"/SocialPostLink?uri={inputUrl}");
Assert.That(result.StatusCode, Is.EqualTo(HttpStatusCode.BadRequest));
}
How to create test-specific configurations using InMemoryCollection
WebApplicationFactory is highly configurable thanks to the ConfigureWebHost method. For instance, you can customize the settings injected into your services.
Usually, you want to rely on the exact same configurations defined in your appsettings.json file to ensure that the system behaves correctly with the “real” configurations.
For example, I defined the key “InstanceName” in the appsettings.json file whose value is “Real”, and whose value is used to create the returned Instance object. We can validate that that value is being read from that source as validated thanks to this test:
[Test]publicasync Task Should_ReadInstanceNameFromSettings()
{
string inputUrl = "https://twitter.com/BelloneDavide/status/1682305491785973760";
var result = await _client.GetFromJsonAsync<Instance>($"/SocialPostLink?uri={inputUrl}");
Assert.That(result.InstanceName, Is.EqualTo("Real"));
}
But some other times you might want to override a specific configuration key.
The ConfigureAppConfiguration method allows you to customize how you manage Configurations by adding or removing sources.
If you want to add some configurations specific to the WebApplicationFactory, you can use AddInMemoryCollection, a method that allows you to add configurations in a key-value format:
protectedoverridevoid ConfigureWebHost(IWebHostBuilder builder)
{
builder.ConfigureAppConfiguration((host, configurationBuilder) =>
{
configurationBuilder.AddInMemoryCollection(
new List<KeyValuePair<string, string?>>
{
new KeyValuePair<string, string?>("InstanceName", "FromTests")
});
});
}
Even if you had the InstanceName configured in your appsettings.json file, the value is now overridden and set to FromTests.
You can validate this change by simply replacing the expected value in the previous test:
[Test]publicasync Task Should_ReadInstanceNameFromSettings()
{
string inputUrl = "https://twitter.com/BelloneDavide/status/1682305491785973760";
var result = await _client.GetFromJsonAsync<Instance>($"/SocialPostLink?uri={inputUrl}");
Assert.That(result.InstanceName, Is.EqualTo("FromTests"));
}
If you also want to discard all the other existing configuration sources, you can call configurationBuilder.Sources.Clear() before AddInMemoryCollection and remove all the other existing configurations.
How to set up custom dependencies for your tests
Maybe you don’t want to resolve all the existing dependencies, but just a subset of them. For example, you might not want to call external APIs with a limited number of free API calls to avoid paying for the test-related calls. You can then rely on Stub classes that simulate the dependency by giving you full control of the behavior.
We want to replace an existing class with a Stub one: we are going to create a stub class that will be used instead of SocialLinkParser:
publicclassStubSocialLinkParser : ISocialLinkParser
{
public LinkInfo GetLinkInfo(Uri postUri) => new LinkInfo
{
SocialNetworkName = "test from stub",
Id = "test id",
SourceUrl = postUri,
Username = "test username" };
}
We can then customize Dependency Injection to use StubSocialLinkParser in place of SocialLinkParser by specifying the dependency within the ConfigureTestServices method:
Finally, we can create a method to validate this change:
[Test]publicasync Task Should_UseStubName()
{
string inputUrl = "https://twitter.com/BelloneDavide/status/1682305491785973760";
var result = await _client.GetFromJsonAsync<Instance>($"/SocialPostLink?uri={inputUrl}");
Assert.That(result.Info.SocialNetworkName, Is.EqualTo("test from stub"));
}
How to create Integration Tests on specific resolved dependencies
Now we are going to test that the SocialLinkParser does its job, regardless of the internal implementation. Right now we have used the Chain of Responsibility pattern, and we rely on the ISocialLinksFactory interface to create the correct sequence of handlers. But we don’t know in the future how we will define the code: maybe we will replace it all with a huge if-else sequence – the most important part is that the code works, regardless of the internal implementation.
We can proceed in two ways: writing tests on the interface or writing tests on the concrete class.
For the sake of this article, we are going to run tests on the SocialLinkParser class. Not the interface, but the concrete class. The first step is to add the class to the DI engine in the Program class:
builder.Services.AddScoped<SocialLinkParser>();
Now we can create a test to validate that it is working:
[Test]publicasync Task Should_ResolveDependency()
{
using (var _scope = _factory.Services.CreateScope())
{
var service = _scope.ServiceProvider.GetRequiredService<SocialLinkParser>();
Assert.That(service, Is.Not.Null);
Assert.That(service, Is.AssignableTo<SocialLinkParser>());
}
}
As you can see, we are creating an IServiceScope by calling _factory.Services.CreateScope(). Since we have to discard this scope after the test run, we have to place it within a using block. Then, we can create a new instance of SocialLinkParser by calling _scope.ServiceProvider.GetRequiredService<SocialLinkParser>() and create all the tests we want on the concrete implementation of the class.
The benefit of this approach is that you have all the internal dependencies already resolved, without relying on mocks. You can then ensure that everything, from that point on, works as you expect.
Here I created the scope within a using block. There is another approach that I prefer: create the scope instance in the SetUp method, and call Dispose() on it the the TearDown phase:
Sometimes you just want to see the logs generated by your application to help you debug an issue (yes, you can simply debug the application!). But, unless properly configured, the application logs will not be available to you.
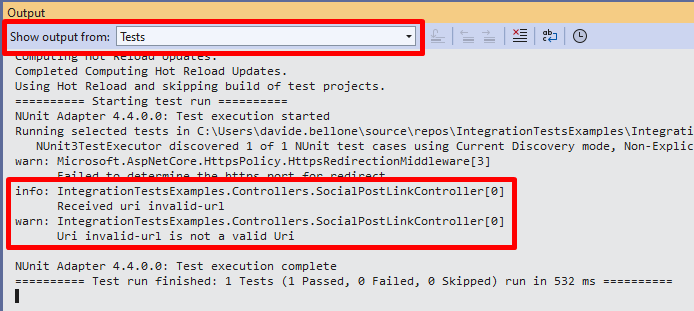
But you can add logs to the console easily by customizing the adding the Console sink in your ConfigureTestServices method:
Now you will be able to see all the logs you generated in the Output panel of Visual Studio by selecting the Tests source:
Beware that you are still reading the configurations for logging from the appsettings file! If you have specified in your project to log directly to a sink (such as DataDog or SEQ), your tests will send those logs to the specified sinks. Therefore, you should get rid of all the other logging sources by calling ClearProviders():
As I often say, a few Integration Tests are often more useful than a ton of Unit Tests. Focusing on Integration Tests instead that on Unit Tests has the benefit of ensuring that the system behaves correctly regardless of the internal implementation.
In this article, I used the Chain of Responsibility pattern, so Unit Tests would be tightly coupled to the Handlers. If we decided to move to another pattern, we would have to delete all the existing tests and rewrite everything from scratch.
Therefore, in my opinion, the Testing Diamond is often more efficient than the Testing Pyramid, as I explained here:
Sound is vibration, vision is vibration you can see. I’m always chasing the moment those waves overlap. For a recent Webflow & GSAP community challenge focusing on GSAP Draggable and Inertia Plugin, I decided to push the idea further by building a futuristic audio-reactive visualizer. The concept was to create a sci-fi “anomaly detector” interface that reacts to music in real time, blending moody visuals with sound.
The concept began with a simple image in my mind: a glowing orange-to-white sphere sitting alone in a dark void, the core that would later pulse with the music. To solidify the idea, I ran this prompt through Midjourney: “Glowing orange and white gradient sphere, soft blurry layers, smooth distortion, dark black background, subtle film-grain, retro-analog vibe, cinematic lighting.” After a few iterations I picked the frame that felt right, gave it a quick color pass in Photoshop, and used that clean, luminous orb as the visual foundation for the entire audio-reactive build.
Midjourney explorations
The project was originally built as an entry for the Webflow × GSAP Community Challenge (Week 2: “Draggable & Inertia”), which encouraged the use of GSAP’s dragging and inertia capabilities. This context influenced the features: I made the on-screen control panels draggable with momentum, and even gave the 3D orb a subtle inertia-driven movement when “flung”. In this article, I’ll walk you through the entire process – from setting up the Three.js scene and analyzing audio with the Web Audio API, to creating custom shaders and adding GSAP animations and interactivity. By the end, you’ll see how code, visuals, and sound come together to create an immersive audio visualizer.
Setting Up the Three.js Scene
To build the 3D portion, I used Three.js to create a scene containing a dynamic sphere (the “anomaly”) and other visual elements.
We start with the usual Three.js setup: a scene, a camera, and a renderer. I went with a perspective camera to get a nice 3D view of our orb and placed it a bit back so the object is fully in frame.
An OrbitControls is used to allow basic click-and-drag orbiting around the object (with some damping for smoothness). Here’s a simplified snippet of the initial setup:
// Initialize Three.js scene, camera, renderer
const scene = new THREE.Scene();
const camera = new THREE.PerspectiveCamera(75, window.innerWidth/window.innerHeight, 0.1, 100);
camera.position.set(0, 0, 10);  // camera back a bit from origin

const renderer = new THREE.WebGLRenderer({ antialias: true });
renderer.setSize(window.innerWidth, window.innerHeight);
document.body.appendChild(renderer.domElement);

// Add OrbitControls for camera rotation
const controls = new THREE.OrbitControls(camera, renderer.domElement);
controls.enableDamping = true;
controls.dampingFactor = 0.1;
controls.rotateSpeed = 0.5;
controls.enableZoom = false; // lock zoom for a more fixed view
Next, I created the anomaly object. This is the main feature: a spiky wireframe sphere that reacts to audio. Three.js provides shapes like SphereGeometry or IcosahedronGeometry that we can use for a sphere. I chose an icosahedron geometry because it gives an interesting multi sided look and allows easy control of detail (via a subdivision level). The anomaly is actually composed of two overlapping parts:
Outer wireframe sphere: An IcosahedronGeometry with a custom ShaderMaterial that draws it as a glowing wireframe. This part will distort based on music (imagine it “vibrating” and morphing with the beat).
Inner glow sphere: A slightly larger SphereGeometry drawn with a semi-transparent, emissive shader (using the backside of the geometry) to create a halo or aura around the wireframe. This gives the orb a warm glow effect, like an energy field.
I also added in some extra visuals: a field of tiny particles floating in the background (for a depth effect, like dust or sparks) and a subtle grid overlay in the UI (more on the UI later). The scene’s background is set to a dark color, and I layered a background image (the edited Midjourney visual) behind the canvas to create the mysterious-alien landscape horizon. This combination of 3D objects and 2D backdrop creates the illusion of a holographic display over a planetary surface.
Integrating the Web Audio API for Music Analysis
With the 3D scene in place, the next step was making it respond to music. This is where the Web Audio API comes in. I allowed the user to either upload an audio file or pick one of the four provided tracks. When the audio plays, we tap into the audio stream and analyze its frequencies in real-time using an AnalyserNode. The AnalyserNode gives us access to frequency data. This is a snapshot of the audio spectrum (bass, mids, treble levels, etc.) at any given moment, which we can use to drive animations.
To set this up, I created an AudioContext and an AnalyserNode, and connected an audio source to it. If you’re using an <audio> element for playback, you can create a MediaElementSource from it and pipe that into the analyser. For example:
// Create AudioContext and Analyser
const audioContext = new (window.AudioContext || window.webkitAudioContext)();
const analyser = audioContext.createAnalyser();
analyser.fftSize = 2048;                  // Use an FFT size of 2048 for analysis
analyser.smoothingTimeConstant = 0.8;     // Smooth out the frequencies a bit

// Connect an audio element source to the analyser
const audioElement = document.getElementById('audio-player');  // <audio> element
const source = audioContext.createMediaElementSource(audioElement);
source.connect(analyser);
analyser.connect(audioContext.destination);  // connect to output so sound plays
Here we set fftSize to 2048, which means the analyser will break the audio into 1024 frequency bins (frequencyBinCount is half of fftSize). We also set a smoothingTimeConstant to make the data less jumpy frame-to-frame. Now, as the audio plays, we can repeatedly query the analyser for data. The method analyser.getByteFrequencyData(array) fills an array with the current frequency magnitudes (0–255) across the spectrum. Similarly, getByteTimeDomainData gives waveform amplitude data. In our animation loop, I call analyser.getByteFrequencyData() on each frame to get fresh data:
const frequencyData = new Uint8Array(analyser.frequencyBinCount);

function animate() {
  requestAnimationFrame(animate);

  // ... update Three.js controls, etc.
  if (analyser) {
    analyser.getByteFrequencyData(frequencyData);
    // Compute an average volume level from frequency data
    let sum = 0;
    for (let i = 0; i < frequencyData.length; i++) {
      sum += frequencyData[i];
    }
    const average = sum / frequencyData.length;
    let audioLevel = average / 255;  // normalize to 0.0–1.0
    // Apply a sensitivity scaling (from a UI slider)
    audioLevel *= (sensitivity / 5.0);
    // Now audioLevel represents the intensity of the music (0 = silence, ~1 = very loud)
  }

  // ... (use audioLevel to update visuals)
  renderer.render(scene, camera);
}
In my case, I also identified a “peak frequency” (the frequency bin with the highest amplitude at a given moment) and some other metrics just for fun, which I display on the UI (e.g. showing the dominant frequency in Hz, amplitude, etc., as “Anomaly Metrics”). But the key takeaway is the audioLevel – a value representing overall music intensity – which we’ll use to drive the 3D visual changes.
Syncing Audio with Visuals: Once we have audioLevel, we can inject it into our Three.js world. I passed this value into the shaders as a uniform every frame, and also used it to tweak some high-level motion (like rotation speed). Additionally, GSAP animations were triggered by play/pause events (for example, a slight camera zoom when music starts, which we’ll cover next). The result is that the visuals move in time with the music:louder or more intense moments in the audio make the anomaly glow brighter and distort more, while quiet moments cause it to settle down.
Creating the Audio-Reactive Shaders
To achieve the dynamic look for the anomaly, I used custom GLSL shaders in the material. Three.js lets us write our own shaders via THREE.ShaderMaterial, which is perfect for this because it gives fine-grained control over vertex positions and fragment colors. This might sound difficult if you’re new to shaders, but conceptually we did two major things in the shader:
Vertex Distortion with Noise: We displace the vertices of the sphere mesh over time to make it wobble and spike. I included a 3D noise function (Simplex noise) in the vertex shader – it produces a smooth pseudo-random value for any 3D coordinate. For each vertex, I calculate a noise value based on its position (plus a time factor to animate it). Then I move the vertex along its normal by an amount proportional to that noise. We also multiply this by our audioLevel and a user-controlled distortion factor. Essentially, when the music is intense (high audioLevel), the sphere gets spikier and more chaotic; when the music is soft or paused, the sphere is almost smooth.
Fresnel Glow in Fragment Shader: To make the wireframe edges glow and fade realistically, I used a fresnel effect in the fragment shader. This effect makes surfaces more luminous at glancing angles. We calculate it by taking the dot product of the view direction and the vertex normal – it results in a value that’s small on edges (grazing angles) and larger on faces directly facing the camera. By inverting and exponentiating this, we get a nice glow on the outline of the sphere that intensifies at the edges. I modulated the fresnel intensity with the audioLevel as well, so the glow pulsates with the beat.
Let’s look at a simplified version of the shader code for the outer wireframe sphere material:
const outerMaterial = new THREE.ShaderMaterial({
  uniforms: {
    time:      { value: 0 },
    audioLevel:{ value: 0 },            // this will be updated each frame
    distortion:{ value: 1.0 },
    color:     { value: new THREE.Color(0xff4e42) }  // a reddish-orange base color
  },
  wireframe: true,
  transparent: true,
  vertexShader: `
    uniform float time;
    uniform float audioLevel;
    uniform float distortion;
    // (noise function omitted for brevity)

    void main() {
      // Start with the original position
      vec3 pos = position;
      // Calculate procedural noise value for this vertex (using its position and time)
      float noise = snoise(pos * 0.5 + vec3(0.0, 0.0, time * 0.3));
      // Displace vertex along its normal
      pos += normal * noise * distortion * (1.0 + audioLevel);
      // Standard transformation
      gl_Position = projectionMatrix * modelViewMatrix * vec4(pos, 1.0);
    }
  `,
  fragmentShader: `
    uniform vec3 color;
    uniform float audioLevel;
    varying vec3 vNormal;
    varying vec3 vPosition;

    void main() {
      // Calculate fresnel (view-angle dependent) term
      vec3 viewDir = normalize(cameraPosition - vPosition);
      float fresnel = 1.0 - max(0.0, dot(viewDir, vNormal));
      fresnel = pow(fresnel, 2.0 + audioLevel * 2.0);
      // Make the fragment color brighter on edges (fresnel) and pulse it slightly with time
      float pulse = 0.8 + 0.2 * sin(time * 2.0);
      vec3 emissiveColor = color * fresnel * pulse * (1.0 + audioLevel * 0.8);
      // Alpha fade out a bit when audio is high (to make spikes more ethereal)
      float alpha = fresnel * (0.7 - audioLevel * 0.3);
      gl_FragColor = vec4(emissiveColor, alpha);
    }
  `
});
In this shader, snoise is a Simplex noise function (not shown above) producing values ~-1 to 1. The vertex shader uses it to offset each vertex (pos += normal * noise * …). We multiply the noise by (1.0 + audioLevel) so that when audioLevel rises, the displacement increases. The distortion uniform is controlled by a slider in the UI, so the user can manually dial the overall spikiness. The fragment shader calculates a fresnel factor to make the wireframe edges glow. Notice how audioLevel factors into the power and into the final color intensity – louder audio makes the fresnel exponent higher (sharper glow) and also increases brightness a bit. We also included a gentle pulsing (sin(time)) independent of audio, just to give a constant breathing motion.
For the inner glow sphere, we used a separate ShaderMaterial: it’s basically a sphere drawn with side: THREE.BackSide (so we see the inner surface) and Additive Blending to give a blooming halo. Its fragment shader also uses a fresnel term, but with a much lower alpha so it appears as a soft haze around the orb. The inner sphere’s size is slightly larger (I used about 1.2× the radius of the outer sphere) so that the glow extends beyond the wireframe. When combined, the outer and inner shaders create the effect of a translucent, energy-filled orb whose surface ripples with music.
To tie it all together, every frame in the render loop I update the shader uniforms with the current time and audio level:
// in the animation loop:
outerMaterial.uniforms.time.value = elapsedTime;
outerMaterial.uniforms.audioLevel.value = audioLevel;
outerMaterial.uniforms.distortion.value = currentDistortion;
glowMaterial.uniforms.time.value = elapsedTime;
glowMaterial.uniforms.audioLevel.value = audioLevel;
The result is a 3D object that truly feels alive with the music, it oscillates, pulses, and glows in sync with whatever track is playing. Even the one you add.
Animations and Interactions with GSAP
With the visuals reacting to sound, I added GSAP to handle smooth animations and user interactions. GSAP is great for creating timeline sequences and tweening properties with easing, and it also comes with plugins that were perfect for this project: Draggable for click-and-drag UI, and InertiaPlugin for momentum. Best of all, every GSAP plugin is now completely free to use. Below are the key ways I used GSAP in the project:
Intro Animation & Camera Movement: When the user selects a track and hits play, I trigger a brief “activation” sequence. This involves some text appearing in the “terminal” and a slight camera zoom-in toward the orb to signal that the system is online. The camera movement was done with a simple GSAP tween of the camera’s position. For example, I defined a default camera position and a slightly closer “zoomed” position. On play, I use gsap.to() to interpolate the camera position to the zoomed-in coordinates, and on pause/stop I tween it back out. GSAP makes this kind of 3D property animation straightforward:
const defaultCameraPos = { x: 0, y: 0, z: 10 };
const zoomedCameraPos = { x: 0, y: 0, z: 7 }; // move camera closer on zoom

function zoomCameraForAudio(zoomIn) {
  const target = zoomIn ? zoomedCameraPos : defaultCameraPos;
  gsap.to(camera.position, {
    x: target.x,
    y: target.y,
    z: target.z,
    duration: 1.5,
    ease: "power2.inOut"
  });
}

// When audio starts:
zoomCameraForAudio(true);
// When audio ends or is stopped:
zoomCameraForAudio(false);
This smooth zoom adds drama when the music kicks in, drawing the viewer into the scene. The power2.inOut easing gives it a nice gentle start and stop. I also used GSAP timelines for any other scripted sequences (like fading out the “Analyzing…” overlay text after a few seconds, etc.), since GSAP’s timeline control is very handy for orchestrating arranging multiple animations in order.
Draggable UI Panels: The interface has a few UI components overlaying the 3D canvas – e.g. an “Anomaly Controls” panel (with sliders for rotation speed, distortion amount, etc.), an “Audio Spectrum Analyzer” panel (showing a bar graph of frequencies and track selection buttons), and a “System Terminal” readout (displaying log messages like a console). To make the experience playful, I made these panels draggable. Using GSAP’s Draggable plugin, I simply turned each .panel element into a draggable object:
Draggable.create(".panel", {
  type: "x,y",
  bounds: "body",         // confine dragging within the viewport
  inertia: true,          // enable momentum after release
  edgeResistance: 0.65,   // a bit of resistance at the edges
  onDragStart: () => { /* bring panel to front, etc. */ },
  onDragEnd: function() {
    // Optionally, log the velocity or other info for fun
    console.log("Panel thrown with velocity:", this.getVelocity());
  }
});
Setting inertia: true means when the user releases a panel, it will continue moving in the direction they tossed it, gradually slowing to a stop (thanks to InertiaPlugin). This little touch makes the UI feel more tactile and real – you can flick the panels around and they slide with some “weight.” According to GSAP’s docs, Draggable will automatically handle the physics when inertia is enabled , so it was plug-and-play. I also constrained dragging within the body bounds so panels don’t get lost off-screen. Each panel has a clickable header (a drag handle area), set via the handle option, to restrict where a user can grab it. Under the hood, InertiaPlugin calculates the velocity of the drag and creates a tween that smoothly decelerates the element after you let go, mimicking friction.
Interactive Orb Drag (Bonus): As a creative experiment, I even made the 3D anomaly orb itself draggable. This was a bit more involved since it’s not a DOM element, but I implemented it by raycasting for clicks on the 3D object and then rotating the object based on mouse movement. I applied a similar inertia effect manually: when you “throw” the orb, it keeps spinning and slowly comes to rest. This wasn’t using GSAP’s Draggable directly (since that works in screen space), but I did use the InertiaPlugin concept by capturing the drag velocity and then using an inertial decay on that velocity each frame. It added a fun way to interact with the visualizer – you can nudge the orb and see it respond physically. For example, if you drag and release quickly, the orb will continue rotating with momentum. This kind of custom 3D dragging is outside the scope of a basic tutorial, but it shows how you can combine your own logic with GSAP’s physics concepts to enrich interactions.
GSAP Draggable and Inertia in action
In summary, GSAP handles all the non-audio animations: the camera moves, panel drags, and little transitions in the UI. The combination of sound-reactive shader animations (running every frame based on audio data) and event-based GSAP tweens (triggered on user actions or certain times) gives a layered result where everything feels responsive and alive.
UI and Atmosphere
Finally, a few words about the surrounding UI/atmosphere which glue the experience together. The visualizer’s style was inspired by sci-fi control panels, so I leaned into that:
Control Panels and Readouts: I built the overlay UI with HTML/CSS, keeping it minimalistic (just semi-transparent dark panels with light text and a few sliders/buttons). Key controls include rotation speed (how fast the orb spins), resolution (tessellation level of the icosahedron mesh), distortion amount, audio reactivity (scaling of audio impact), and sensitivity (which adjusts how the audio’s volume is interpreted). Changing these in real-time immediately affects the Three.js scene – for example, dragging the “Resolution” slider rebuilds the icosahedron geometry with more or fewer triangles, which is a cool way to see the orb go from coarse to finely subdivided. The “Audio Spectrum Analyzer” panel displays a classic bar graph of frequencies (drawn on a canvas using the analyser data) so you have a 2D visualization accompanying the 3D one. There’s also a console-style terminal readout that logs events (like “AUDIO ANALYSIS SYSTEM INITIALIZED” or the velocity of drags in a playful GSAP log format) to reinforce the concept of a high-tech system at work.
Design elements: To boost the sci-fi feel, I added a subtle grid overlay across the whole screen. This was done with pure CSS – a pair of repeating linear gradients forming horizontal and vertical lines (1px thin, very transparent) over a transparent background . It’s barely noticeable but gives a technical texture, especially against the glow of the orb. I also added some drifting ambient particles (tiny dots) floating slowly in the background, implemented as simple divs animated with JavaScript. They move in pseudo-random orbits.
Soundtrack: I curated three atmospheric and moody tracks, along with one of my own unreleased tracks, under my music alias LXSTNGHT. The track was produced in Ableton, and it’s unfinished. The end result is an experience where design, code, and music production collide in real time.
Bringing all these elements together, the final result is an interactive art piece: you load a track, the “Audio ARK” system comes online with a flurry of text feedback, the ambient music starts playing, and the orb begins to pulse and mutate in sync with the sound. You can tweak controls or toss around panels (or the orb itself) to explore different visuals.
The combination of Three.js (for rendering and shader effects), Web Audio API (for sound analysis), and GSAP (for polished interactions) showcases how creative coding tools can merge to produce an immersive experience that engages multiple senses.
Understanding the Fetch API can be challenging, particularly for those new to JavaScript’s unique approach to handling asynchronous operations. Among the many features of modern JavaScript, the Fetch API stands out for its ability to handle network requests elegantly. However, the syntax of chaining .then() methods can seem unusual at first glance. To fully grasp how the Fetch API works, it’s vital to understand three core concepts:
In programming, synchronous code is executed in sequence. Each statement waits for the previous one to finish before executing. JavaScript, being single-threaded, runs code in a linear fashion. However, certain operations, like network requests, file system tasks, or timers, could block this thread, making the user experience unresponsive.
Here’s a simple example of synchronous code:
function doTaskOne() { console.log('Task 1 completed'); }
function doTaskTwo() { console.log('Task 2 completed'); }