Did you know that in .NET you can resolve specific dependencies using Factories? We’ll use them to switch between concrete classes based on the current HTTP Request
Table of Contents
Just a second! 🫷
If you are here, it means that you are a software developer.
So, you know that storage, networking, and domain management have a cost .If you want to support this blog, please ensure that you have disabled the adblocker for this site.
I configured Google AdSense to show as few ADS as possible – I don’t want to bother you with lots of ads, but I still need to add some to pay for the resources for my site.Thank you for your understanding.
– Davide
Say that you have an interface and that you want to specify its concrete class at runtime using the native Dependency Injection engine provided by .NET.
For instance, imagine that you have a .NET API project and that the flag that tells the application which dependency to use is set in the HTTP Request.
Can we do it? Of course, yes – otherwise I wouldn’t be here writing this article 😅 Let’s learn how!
Why use different dependencies?
But first: does all of this make sense? Is there any case when you want to inject different services at runtime?
Let me share with you a story: once I had to create an API project which exposed just a single endpoint: Process(string ID).
That endpoint read the item with that ID from a DB – an object composed of some data and some hundreds of children IDs – and then called an external service to download an XML file for every child ID in the object; then, every downloaded XML file would be saved on the file system of the server where the API was deployed to. Finally, a TXT file with the list of the items correctly saved on the file system was generated.
Quite an easy task: read from DB, call some APIs, store the file, store the report file. Nothing more.
But, how to run it locally without saving hundreds of files for every HTTP call?
I decided to add a simple Query Parameter to the HTTP path and let .NET understand whether use the concrete class or a fake one. Let’s see how.
Define the services on ConfigureServices
As you may know, the dependencies are defined in the ConfigureServices method inside the Startup class.
Here we can define our dependencies. For this example, we have an interface, IFileSystemAccess, which is implemented by two classes: FakeFileSystemAccess and RealFileSystemAccess.
So, to define those mutable dependencies, you can follow this snippet:
public void ConfigureServices(IServiceCollection services)
{
    services.AddControllers();

    services.AddHttpContextAccessor();

    services.AddTransient<FakeFileSystemAccess>();
    services.AddTransient<RealFileSystemAccess>();

    services.AddScoped<IFileSystemAccess>(provider =>
    {
        var context = provider.GetRequiredService<IHttpContextAccessor>();

        var useFakeFileSystemAccess = context.HttpContext?.Request?.Query?.ContainsKey("fake-fs") ?? false;

        if (useFakeFileSystemAccess)
            return provider.GetRequiredService<FakeFileSystemAccess>();
        else
            return provider.GetRequiredService<RealFileSystemAccess>();
    });
}
As usual, let’s break it down:
Inject dependencies using a Factory
Let’s begin with the king of the article:
services.AddScoped<IFileSystemAccess>(provider =>
{
}
We can define our dependencies by using a factory. For instance, now we are using the AddScoped Extension Method (wanna know some interesting facts about Extension Methods?):
//
// Summary:
//     Adds a scoped service of the type specified in TService with a factory specified
//     in implementationFactory to the specified Microsoft.Extensions.DependencyInjection.IServiceCollection.
//
// Parameters:
//   services:
//     The Microsoft.Extensions.DependencyInjection.IServiceCollection to add the service
//     to.
//
//   implementationFactory:
//     The factory that creates the service.
//
// Type parameters:
//   TService:
//     The type of the service to add.
//
// Returns:
//     A reference to this instance after the operation has completed.
public static IServiceCollection AddScoped<TService>(this IServiceCollection services, Func<IServiceProvider, TService> implementationFactory) where TService : class;
This Extension Method allows us to get the information about the services already injected in the current IServiceCollection instance and use them to define how to instantiate the actual dependency for the TService – in our case, IFileSystemAccess.
Why is this a Scoped dependency? As you might remember from a previous article, in .NET we have 3 lifetimes for dependencies: Singleton, Scoped, and Transient. Scoped dependencies are the ones that get loaded once per HTTP request: therefore, those are the best choice for this specific example.
Reading from Query String
Since we need to read a value from the query string, we need to access the HttpRequest object.
That’s why we have:
var context = provider.GetRequiredService<IHttpContextAccessor>();
var useFakeFileSystemAccess = context.HttpContext?.Request?.Query?.ContainsKey("fake-fs") ?? false;
Here I’m getting the HTTP Context and checking if the fake-fs key is defined. Yes, I know, I’m not checking its actual value: I’m just checking whether the key exists or not.
IHttpContextAccessor is the key part of this snippet: this is a service that acts as a wrap around the HttpContext object. You can inject it everywhere in your code, but under one condition: you have to define it in the ConfigureServices method.
How? Well, that’s simple:
services.AddHttpContextAccessor();
Injecting the dependencies based on the request
Finally, we can define which dependency must be injected for the current HTTP Request:
if (useFakeFileSystemAccess)
    return provider.GetRequiredService<FakeFileSystemAccess>();
else
    return provider.GetRequiredService<RealFileSystemAccess>();
Remember that we are inside a factory method: this means that, depending on the value of useFakeFileSystemAccess, we are defining the concrete class of IFileSystemAccess.
GetRequiredService<T> returns the instance of type T injected in the DI engine. This implies that we have to inject the two different services before accessing them. That’s why you see:
services.AddTransient<FakeFileSystemAccess>();
services.AddTransient<RealFileSystemAccess>();
Those two lines of code serve two different purposes:
- they make those services available to the GetRequiredService method;
- they resolve all the dependencies injected in those services
Running the example
Now that we have everything in place, it’s time to put it into practice.
First of all, we need a Controller with the endpoint we will call:
[ApiController]
[Route("[controller]")]
public class StorageController : ControllerBase
{
    private readonly IFileSystemAccess _fileSystemAccess;

    public StorageController(IFileSystemAccess fileSystemAccess)
    {
        _fileSystemAccess = fileSystemAccess;
    }

    [HttpPost]
    public async Task<IActionResult> SaveContent([FromBody] FileInfo content)
    {
        string filename = $"file-{Guid.NewGuid()}.txt";
        var saveResult = await _fileSystemAccess.WriteOnFile(filename, content.Content);
        return Ok(saveResult);
    }

    public class FileInfo
    {
        public string Content { get; set; }
    }
}
Nothing fancy: this POST endpoint receives an object with some text, and calls IFileSystemAccess to store the file. Then, it returns the result of the operation.
Then, we have the interface:
public interface IFileSystemAccess
{
    Task<FileSystemSaveResult> WriteOnFile(string fileName, string content);
}

public class FileSystemSaveResult
{
    public FileSystemSaveResult(string message)
    {
        Message = message;
    }

    public string Message { get; set; }
}
which is implemented by the two classes:
public class FakeFileSystemAccess : IFileSystemAccess
{
    public Task<FileSystemSaveResult> WriteOnFile(string fileName, string content)
    {
        return Task.FromResult(new FileSystemSaveResult("Used mock File System access"));
    }
}
and
public class RealFileSystemAccess : IFileSystemAccess
{
    public async Task<FileSystemSaveResult> WriteOnFile(string fileName, string content)
    {
        await File.WriteAllTextAsync(fileName, content);
        return new FileSystemSaveResult("Used real File System access");
    }
}
As you could have imagined, only RealFileSystemAccess actually writes on the file system. But both of them return an object with a message that tells us which class completed the operation.
Let’s see it in practice:
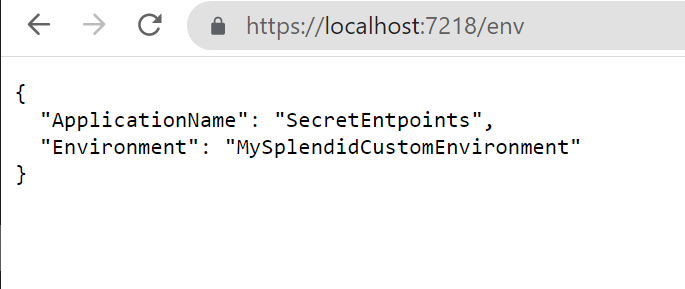
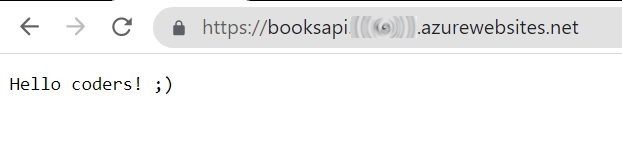
First of all, let’s call the endpoint without anything in Query String:

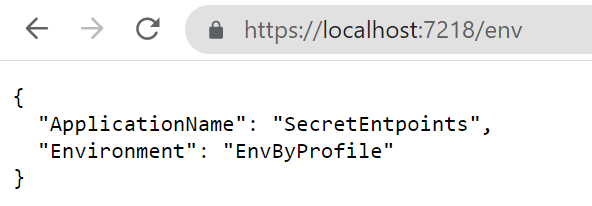
And, then, let’s add the key:

As expected, depending on the query string, we can see two different results.
Of course, you can use this strategy not only with values from the Query String, but also from HTTP Headers, cookies, and whatever comes with the HTTP Request.
Further readings
If you remember, we’ve defined the dependency to IFileSystemAccess as Scoped. Why? What are the other lifetimes native on .NET?
🔗 Dependency Injection lifetimes in .NET | Code4IT
Also, AddScoped is the Extension Method that we used to build our dependencies thanks to a Factory. Here’s an article about some advanced topics about Extension Methods:
🔗 How you can create Extension Methods in C# | Code4IT
Finally, the repository for the code used for this article:
🔗 DependencyInjectionByHttpRequest project | GitHub
Wrapping up
In this article, we’ve seen that we can use a Factory to define at runtime which class will be used when resolving a Dependency.
We’ve used a simple calculation based on the current HTTP request, but of course, there are many other ways to achieve a similar result.
What would you use instead? Have you ever used a similar approach? And why?
Happy coding!
🐧