In 2024, one industry stood out in the India Cyber Threat Report—not for its technological advancements but for its vulnerability: healthcare. According to India Cyber Threat Report 2025, the healthcare sector accounted for 21.82% of all cyberattacks, making it the most targeted industry in India.
But why is healthcare such a lucrative target for cybercriminals?
The Perfect Storm of Opportunity
Healthcare organizations are in a uniquely precarious position. They house vast amounts of sensitive personal and medical data, operate mission-critical systems, and often lack mature cybersecurity infrastructure. In India, the rapid digitization of healthcare — from hospital management systems to telemedicine — has outpaced the sector’s ability to secure these new digital touchpoints.
This creates a perfect storm: high-value data, low resilience, and high urgency. Threat actors know that healthcare providers are more likely to pay ransoms quickly to restore operations, especially when patient care is on the line.
How Cybercriminals are Attacking
The India Cyber Threat Report highlights a mix of attack vectors used against healthcare organizations:
Ransomware: Threat groups such as LockBit 3.0 and RansomHub deploy advanced ransomware strains that encrypt data and disrupt services. These strains are often delivered through phishing campaigns or unpatched vulnerabilities.
Trojans and Infectious Malware: Malware masquerading as legitimate software is a standard tool for gaining backdoor access to healthcare networks.
Social Engineering and Phishing: Fake communications from supposed government health departments or insurance providers lure healthcare staff into compromising systems.
What Needs to Change
The key takeaway is clear: India’s healthcare organizations need to treat cybersecurity as a core operational function, not an IT side task. Here’s how they can begin to strengthen their cyber posture:
Invest in Behavior-Based Threat Detection: Traditional signature-based antivirus tools are insufficient. As seen in the rise from 12.5% to 14.5% of all malware detections, behavior-based detection is becoming critical to identifying unknown or evolving threats.
Harden Endpoint Security: With 8.44 million endpoints analyzed in the report, it’s evident that endpoint defense is a frontline priority. Solutions like Seqrite Endpoint Security offer real-time protection, ransomware rollback, and web filtering tailored for sensitive environments like hospitals.
Educate and Train Staff: Many successful attacks begin with a simple phishing email. Healthcare workers need regular training on identifying suspicious communications and maintaining cyber hygiene.
Backup and Response Plans: Ensure regular, encrypted backups of critical systems and have an incident response plan ready to reduce downtime and mitigate damage during an attack.
Looking Ahead
The India Cyber Threat Report 2025 is a wake-up call. As threat actors grow more sophisticated — using generative AI for deepfake scams and exploiting cloud misconfigurations — the time for reactive cybersecurity is over.
At Seqrite, we are committed to helping Indian enterprises build proactive, resilient, and adaptive security frameworks, especially in vital sectors like healthcare. Solutions like our Seqrite Threat Intel platform and Malware Analysis Platform (SMAP) are built to give defenders the needed edge.
Cyber safety is not just a technical concern — it’s a human one. Let’s secure healthcare, one system at a time.
Application Insights is a great tool for handling high volumes of logs. How can you configure an ASP.NET application to send logs to Azure Application Insights? What can I do to have Application Insights log my exceptions?
Table of Contents
Just a second! 🫷 If you are here, it means that you are a software developer.
So, you know that storage, networking, and domain management have a cost .
If you want to support this blog, please ensure that you have disabled the adblocker for this site. I configured Google AdSense to show as few ADS as possible – I don’t want to bother you with lots of ads, but I still need to add some to pay for the resources for my site.
Thank you for your understanding. – Davide
Logging is crucial for any application. However, generating logs is not enough: you must store them somewhere to access them.
Application Insights is one of the tools that allows you to store your logs in a cloud environment. It provides a UI and a query editor that allows you to drill down into the details of your logs.
In this article, we will learn how to integrate Azure Application Insights with an ASP.NET Core application and how Application Insights treats log properties such as Log Levels and exceptions.
For the sake of this article, I’m working on an API project with HTTP Controllers with only one endpoint. The same approach can be used for other types of applications.
How to retrieve the Azure Application Insights connection string
Azure Application Insights can be accessed via any browser by using the Azure Portal.
Once you have an instance ready, you can simply get the value of the connection string for that resource.
You can retrieve it in two ways.
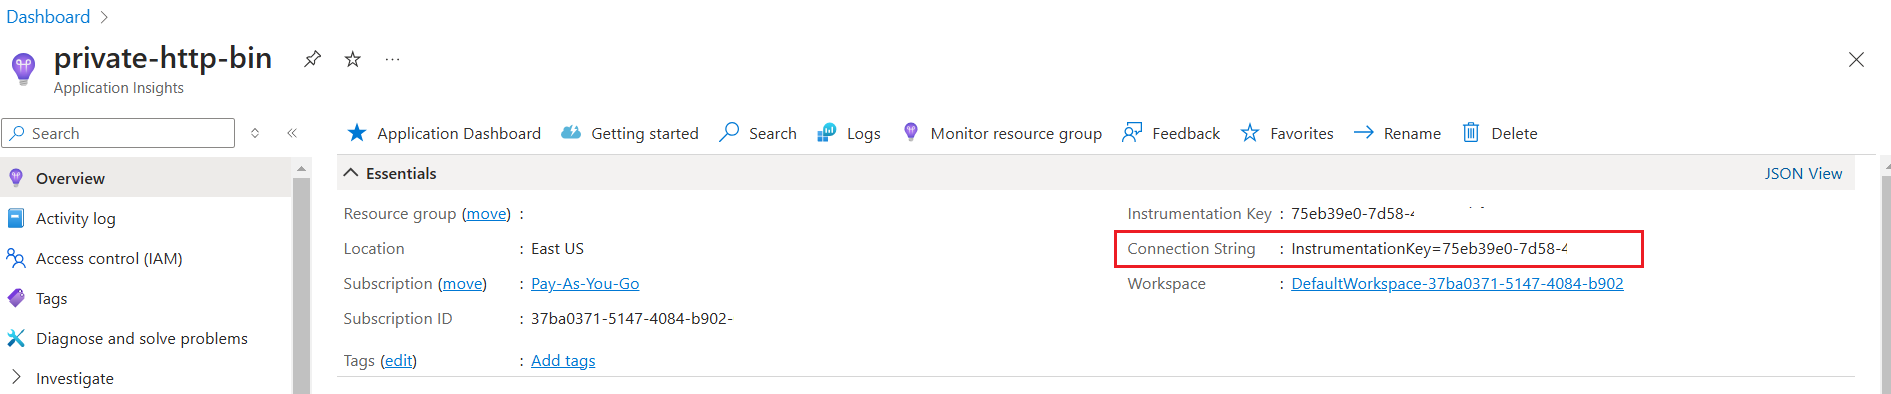
You can get the connection string by looking at the Connection String property in the resource overview panel:
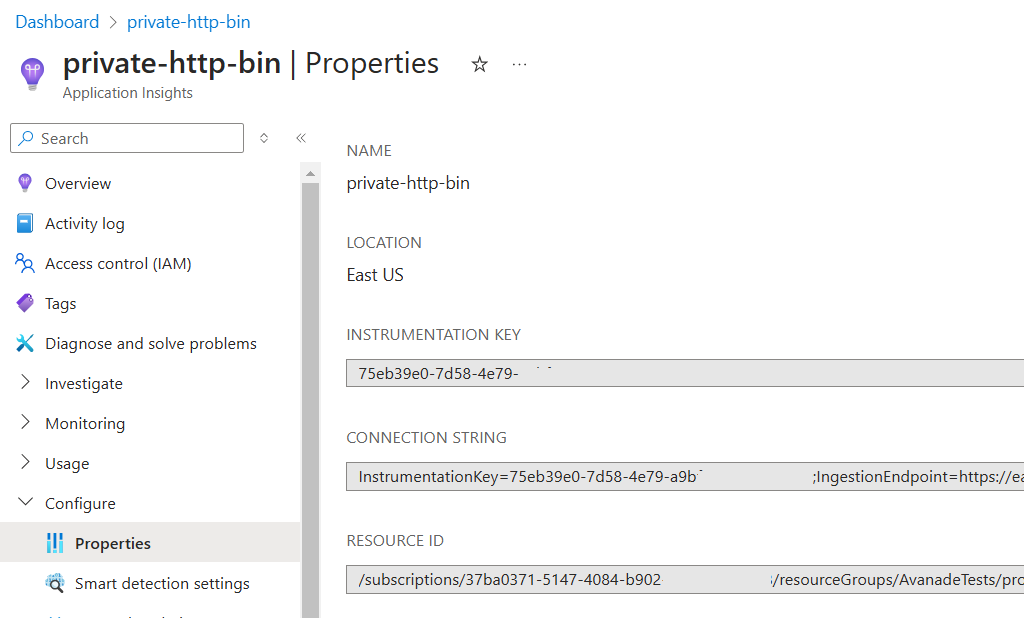
The alternative is to navigate to the Configure > Properties page and locate the Connection String field.
How to add Azure Application Insights to an ASP.NET Core application
Now that you have the connection string, you can place it in the configuration file or, in general, store it in a place that is accessible from your application.
To configure ASP.NET Core to use Application Insights, you must first install the Microsoft.Extensions.Logging.ApplicationInsights NuGet package.
Now you can add a new configuration to the Program class (or wherever you configure your services and the ASP.NET core pipeline):
The configureApplicationInsightsLoggerOptions allows you to configure some additional properties: TrackExceptionsAsExceptionTelemetry, IncludeScopes, and FlushOnDispose. These properties are by default set to true, so you probably don’t want to change the default behaviour (except one, which we’ll modify later).
And that’s it! You have Application Insights ready to be used.
How log levels are stored and visualized on Application Insights
I have this API endpoint that does nothing fancy: it just returns a random number.
We can use it to run experiments on how logs are treated using Application Insights.
First, let’s add some simple log messages in the Get endpoint:
[HttpGet]publicasync Task<IActionResult> Get()
{
int number = Random.Shared.Next();
_logger.LogDebug("A debug log");
_logger.LogTrace("A trace log");
_logger.LogInformation("An information log");
_logger.LogWarning("A warning log");
_logger.LogError("An error log");
_logger.LogCritical("A critical log");
return Ok(number);
}
These are just plain messages. Let’s search for them in Application Insights!
You first have to run the application – duh! – and wait for a couple of minutes for the logs to be ready on Azure. So, remember not to close the application immediately: you have to give it a few seconds to send the log messages to Application Insights.
Then, you can open the logs panel and access the logs stored in the traces table.
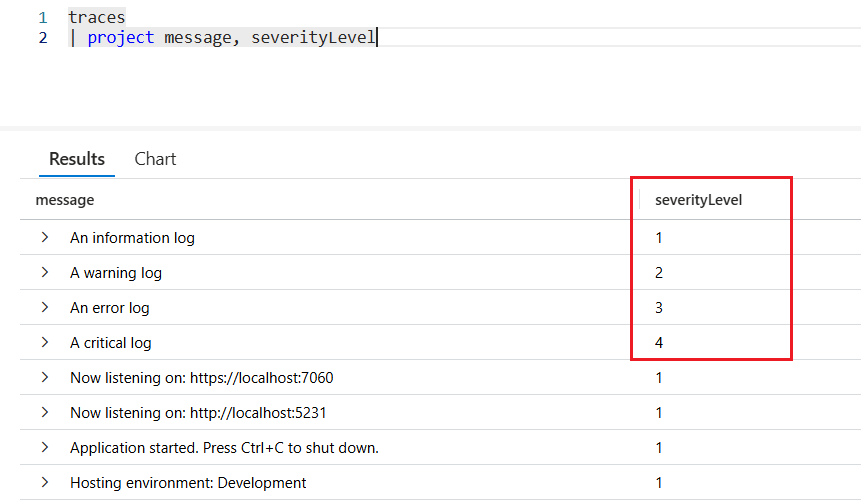
As you can see, the messages appear in the query result.
There are three important things to notice:
in .NET, the log level is called “Log Level”, while on Application Insights it’s called “severity level”;
the log levels lower than Information are ignored by default (in fact, you cannot see them in the query result);
the Log Levels are exposed as numbers in the severityLevel column: the higher the value, the higher the log level.
So, if you want to update the query to show only the log messages that are at least Warnings, you can do something like this:
traces
| where severityLevel >= 2
| order  by timestamp desc
| project timestamp, message, severityLevel
How to log exceptions on Application Insights
In the previous example, we logged errors like this:
_logger.LogError("An error log");
Fortunately, ILogger exposes an overload that accepts an exception in input and logs all the details.
Let’s try it by throwing an exception (I chose AbandonedMutexException because it’s totally nonsense in this simple context, so it’s easy to spot).
privatevoid SomethingWithException(int number)
{
try {
_logger.LogInformation("In the Try block");
thrownew AbandonedMutexException("An exception message");
}
catch (Exception ex)
{
_logger.LogInformation("In the Catch block");
_logger.LogError(ex, "Unable to complete the operation");
}
finally {
_logger.LogInformation("In the Finally block");
}
}
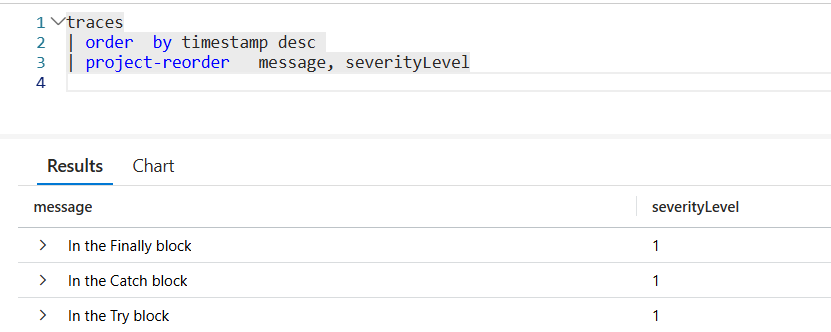
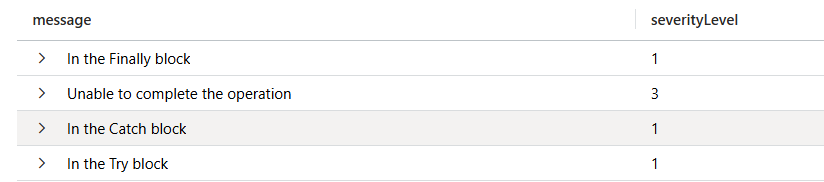
So, when calling it, we expect to see 4 log entries, one of which contains the details of the AbandonedMutexException exception.
Hey, where is the exception message??
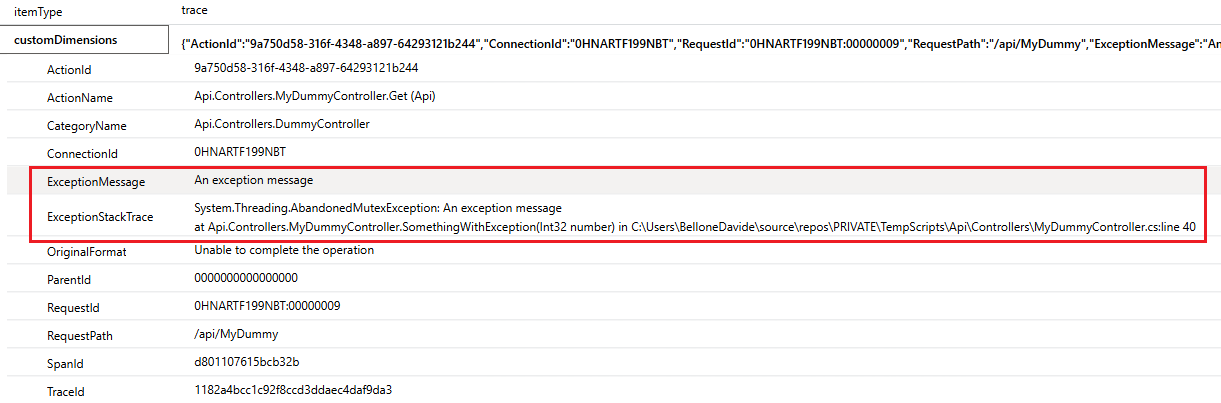
It turns out that ILogger, when creating log entries like _logger.LogError("An error log");, generates objects of type TraceTelemetry. However, the overload that accepts as a first parameter an exception (_logger.LogError(ex, "Unable to complete the operation");) is internally handled as an ExceptionTelemetry object. Since internally, it’s a different type of Telemetry object, and it gets ignored by default.
To enable logging exceptions, you have to update the way you add Application Insights to your application by setting the TrackExceptionsAsExceptionTelemetry property to false:
It’s not the first time we have written about logging in this blog.
For example, suppose you don’t want to use Application Insights but prefer an open-source, vendor-independent log sink. In that case, my suggestion is to try Seq:
This article taught us how to set up Azure Application Insights in an ASP.NET application.
We touched on the basics, discussing log levels and error handling. In future articles, we’ll delve into some other aspects of logging, such as correlating logs, understanding scopes, and more.
I hope you enjoyed this article! Let’s keep in touch on LinkedIn, Twitter or BlueSky! 🤜🤛