برچسب: Performance

  • 14 to 2 seconds: how I improved the performance of an endpoint by 82%


    Language details may impact application performance. In this article we’ll see some of the C# tips that brought me to improve my application. Singleton creation, StringBuilder and more!

    Table of Contents

    Just a second! 🫷
    If you are here, it means that you are a software developer.
    So, you know that storage, networking, and domain management have a cost .

    If you want to support this blog, please ensure that you have disabled the adblocker for this site.
    I configured Google AdSense to show as few ADS as possible – I don’t want to bother you with lots of ads, but I still need to add some to pay for the resources for my site.

    Thank you for your understanding.
    Davide

    In this second article, I’m going to share some more tips that brought me to improve the performance of an API from 14sec to less than 3 seconds: an improvement of 82%.

    In the previous article, we’ve seen some general, language-agnostic ways to approach this kind of problem, and what you can try (and avoid) to do to achieve a similar result.

    In this article, we’re going to see some .NET-related tips that can help to improve your APIs performance.

    WarmUp your application using Postman to create Singleton dependencies

    In my application, we use (of course) dependency injection. Almost all the dependencies are marked ad Singleton: this means that every dependency is created at the start-up of the application and is then shared through all the lifespan of the application.

    Pss: if you want to know the difference between Singleton, Transient, and Scoped lifetimes with real examples, check out this article!

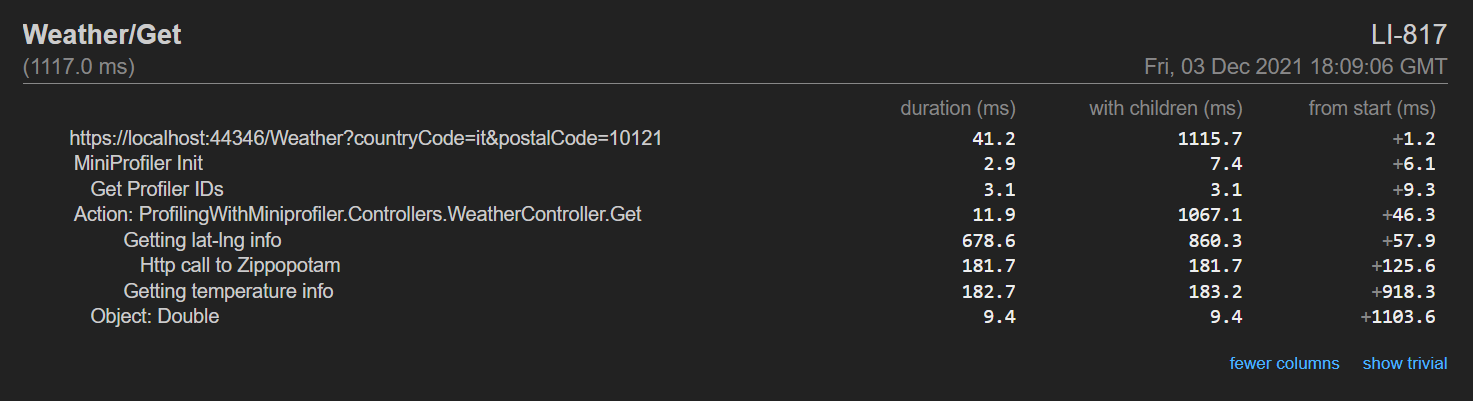
    It makes sense, right? But have a closer look at the timing in this picture:

    Timings with initial warmup time

    The blue line is the whole HTTP call, and the black line is the API Action.

    There are almost 2 seconds of nothing! Why?

    Well, as explained in the article “Reducing initial request latency by pre-building services in a startup task in ASP.NET Core” by Andrew Lock, singletons are created during the first request, not at the real start-up of the application. And, given that all the dependencies in this application are singletons, the first 2 seconds are being used to create those instances.

    While Andrew explains how to create a Startup task to warm up the dependencies, I opted for a quick-and-dirty option: create a Warmup endpoint and call it before any call in Postman.

    [HttpGet, Route("warmup")]
    public ActionResult<string> WarmUp()
    {
        var obj = new
        {
            status = "ready"
        };
    
        return Ok(obj);
    }
    

    It is important to expose that endpoint under a controller that uses DI: as we’ve seen before, dependencies are created during the first request they’re needed; so, if you create an empty controller with only the WarmUp method, you won’t build any dependency and you’ll never see improvements. My suggestion is to place the WarmUp method under a controller that requires one of the root services: in this way, you’ll create the services and all their dependencies.

    To call the WarmUp endpoint before every request, I’ve created this simple script:

    pm.sendRequest("https://localhost:44326/api/warmup", function (err, response) {
      console.log("ok")
    })
    

    So, if you paste it in Postman, into the Pre-requests Script tab, it executes this call before the main HTTP call and warms up your application.

    Pre-request script on Postman

    This tip will not speed up your application but gives your a more precise value for the timings.

    Improve language-specific details

    Understanding how C# works and what functionalities it offers is crucial to get well working applications.

    There’s plenty of articles around the Internet that tell you some nice tips and trick to improve .NET performance; here I’ll list some of my favorite tips an why you should care about them.

    Choose the correct data type

    There’s a lot you can do, like choosing the right data type: if you are storing a player’s age, is int the right choice? Remember that int.MinValue is -2147483648 and int.MaxValue is -2147483648.

    You could use byte: its range is [0,255], so it’s perfectly fine to use it.

    To have an idea of what data type to choose, here’s a short recap with the Min value, the Max value, and the number of bytes occupied by that data type:

    Data type Min value Max Value # of bytes
    byte 0 255 1
    short -32768 32767 2
    ushort 0 65535 2
    int -2147483648 2147483647 4
    uint 0 4294967295 4

    So, just by choosing the right data type, you’ll improve memory usage and then the overall performance.

    It will not bring incredible results, but it’s a good idea to think well of what you need and why you should use a particular data type.

    StringBuilder instead of string concatenation

    Strings are immutable, in C#. This means that every time you concatenate 2 strings, you are actually creating a third one that will contain the result.

    So, have a look at this snippet of code:

    string result = "<table>";
    for (int i = 0; i < 19000; i++)
    {
        result += "<tr><td>"+i+"</td><td>Number:"+i+"</td></tr>";
    }
    
    result += "</table>";
    
    Console.WriteLine(result);
    

    This loop took 2784 milliseconds.

    That’s where the StringBuilder class comes in handy: you avoid all the concatenation and store all the substrings in the StringBuilder object:

    StringBuilder result = new StringBuilder();
    
    result.Append("<table>");
    for (int i = 0; i < 19000; i++)
    {
        result.Append("<tr><td>");
        result.Append(i);
        result.Append("</td><td>Number:");
        result.Append(i);
        result.Append("</td></tr>");
    }
    
    result.Append("</table>");
    
    Console.WriteLine(result.ToString());
    

    Using StringBuilder instead of string concatenation I got the exact same result as the example above but in 58 milliseconds.

    So, just by using the StringBuilder, you can speed up that part by 98%.

    Don’t return await if it’s the only operation in that method

    Every time you mark a method as async, behind the scenes .NET creates a state machine that keeps track of the execution of each method.

    So, have a look at this program where every method returns the result from another one. Pay attention to the many return await statements;

    async Task Main()
    {
        var isAvailable = await IsArticleAvailable();
        Console.WriteLine(isAvailable);
    }
    
    async Task<bool> IsArticleAvailable()
    {
        var articlePath = "/blog/clean-code-error-handling";
        return await IsPathAvailable(articlePath);
    }
    
    async Task<bool> IsPathAvailable(string articlePath)
    {
        var baseUrl = "https://www.code4it.dev/";
        return await IsResourceAvailable(baseUrl, articlePath);
    }
    
    async Task<bool> IsResourceAvailable(string baseUrl, string articlePath)
    {
        using (HttpClient client = new HttpClient() { BaseAddress = new Uri(baseUrl) })
        {
            HttpResponseMessage response = await client.GetAsync(articlePath);
            return response.IsSuccessStatusCode;
        }
    }
    

    So, what did I mean with state machine?

    Here’s just a small part of the result of the decompilation of that code. It’s a looooong listing: don’t focus on the details, just have a look at the general structure:

    If you are interested in the full example, here you can find the gist with both the original and the decompiled file.

    internal static class <Program>$
    {
        private sealed class <<<Main>$>g__Main|0_0>d : IAsyncStateMachine
        {
            public int <>1__state;
    
            public AsyncTaskMethodBuilder <>t__builder;
    
            private bool <isAvailable>5__1;
    
            private bool <>s__2;
    
            private TaskAwaiter<bool> <>u__1;
    
            private void MoveNext()
            {
                int num = <>1__state;
                try
                {
                    TaskAwaiter<bool> awaiter;
                    if (num != 0)
                    {
                        awaiter = <<Main>$>g__IsArticleAvailable|0_1().GetAwaiter();
                        if (!awaiter.IsCompleted)
                        {
                            num = (<>1__state = 0);
                            <>u__1 = awaiter;
                            <<<Main>$>g__Main|0_0>d stateMachine = this;
                            <>t__builder.AwaitUnsafeOnCompleted(ref awaiter, ref stateMachine);
                            return;
                        }
                    }
                    else
                    {
                        awaiter = <>u__1;
                        <>u__1 = default(TaskAwaiter<bool>);
                        num = (<>1__state = -1);
                    }
                    <>s__2 = awaiter.GetResult();
                    <isAvailable>5__1 = <>s__2;
                    Console.WriteLine(<isAvailable>5__1);
                }
                catch (Exception exception)
                {
                    <>1__state = -2;
                    <>t__builder.SetException(exception);
                    return;
                }
                <>1__state = -2;
                <>t__builder.SetResult();
            }
    
            void IAsyncStateMachine.MoveNext()
            {
                //ILSpy generated this explicit interface implementation from .override directive in MoveNext
                this.MoveNext();
            }
    
            [DebuggerHidden]
            private void SetStateMachine(IAsyncStateMachine stateMachine)
            {
            }
    
            void IAsyncStateMachine.SetStateMachine(IAsyncStateMachine stateMachine)
            {
                //ILSpy generated this explicit interface implementation from .override directive in SetStateMachine
                this.SetStateMachine(stateMachine);
            }
        }
    
        private sealed class <<<Main>$>g__IsArticleAvailable|0_1>d : IAsyncStateMachine
        {
            public int <>1__state;
    
            public AsyncTaskMethodBuilder<bool> <>t__builder;
    
            private string <articlePath>5__1;
    
            private bool <>s__2;
    
            private TaskAwaiter<bool> <>u__1;
    
            private void MoveNext()
            {
                int num = <>1__state;
                bool result;
                try
                {
                    TaskAwaiter<bool> awaiter;
                    if (num != 0)
                    {
                        <articlePath>5__1 = "/blog/clean-code-error-handling";
                        awaiter = <<Main>$>g__IsPathAvailable|0_2(<articlePath>5__1).GetAwaiter();
                        if (!awaiter.IsCompleted)
                        {
                            num = (<>1__state = 0);
                            <>u__1 = awaiter;
                            <<<Main>$>g__IsArticleAvailable|0_1>d stateMachine = this;
                            <>t__builder.AwaitUnsafeOnCompleted(ref awaiter, ref stateMachine);
                            return;
                        }
                    }
                    else
                    {
                        awaiter = <>u__1;
                        <>u__1 = default(TaskAwaiter<bool>);
                        num = (<>1__state = -1);
                    }
                    <>s__2 = awaiter.GetResult();
                    result = <>s__2;
                }
                catch (Exception exception)
                {
                    <>1__state = -2;
                    <articlePath>5__1 = null;
                    <>t__builder.SetException(exception);
                    return;
                }
                <>1__state = -2;
                <articlePath>5__1 = null;
                <>t__builder.SetResult(result);
            }
    
            void IAsyncStateMachine.MoveNext()
            {
                //ILSpy generated this explicit interface implementation from .override directive in MoveNext
                this.MoveNext();
            }
    
            [DebuggerHidden]
            private void SetStateMachine(IAsyncStateMachine stateMachine)
            {
            }
    
            void IAsyncStateMachine.SetStateMachine(IAsyncStateMachine stateMachine)
            {
                //ILSpy generated this explicit interface implementation from .override directive in SetStateMachine
                this.SetStateMachine(stateMachine);
            }
        }
    
        [AsyncStateMachine(typeof(<<<Main>$>g__IsArticleAvailable|0_1>d))]
        [DebuggerStepThrough]
        internal static Task<bool> <<Main>$>g__IsArticleAvailable|0_1()
        {
            <<<Main>$>g__IsArticleAvailable|0_1>d stateMachine = new <<<Main>$>g__IsArticleAvailable|0_1>d();
            stateMachine.<>t__builder = AsyncTaskMethodBuilder<bool>.Create();
            stateMachine.<>1__state = -1;
            stateMachine.<>t__builder.Start(ref stateMachine);
            return stateMachine.<>t__builder.Task;
        }
    

    Every method marked as async “creates” a class that implements the IAsyncStateMachine interface and implements the MoveNext method.

    So, to improve performance, we have to get rid of lots of this stuff: we can do it by simply removing await calls when there is only one awaited method and you do nothing after calling that method.

    So, we can transform the previous snippet:

    async Task Main()
    {
        var isAvailable = await IsArticleAvailable();
        Console.WriteLine(isAvailable);
    }
    
    async Task<bool> IsArticleAvailable()
    {
        var articlePath = "/blog/clean-code-error-handling";
        return await IsPathAvailable(articlePath);
    }
    
    async Task<bool> IsPathAvailable(string articlePath)
    {
        var baseUrl = "https://www.code4it.dev/";
        return await IsResourceAvailable(baseUrl, articlePath);
    }
    
    async Task<bool> IsResourceAvailable(string baseUrl, string articlePath)
    {
        using (HttpClient client = new HttpClient() { BaseAddress = new Uri(baseUrl) })
        {
            HttpResponseMessage response = await client.GetAsync(articlePath);
            return response.IsSuccessStatusCode;
        }
    }
    

    into this one:

    async Task Main()
    {
        var isAvailable = await IsArticleAvailable();
        Console.WriteLine(isAvailable);
    }
    
    Task<bool> IsArticleAvailable()
    {
        var articlePath = "/blog/clean-code-error-handling";
        return IsPathAvailable(articlePath);
    }
    
    Task<bool> IsPathAvailable(string articlePath)
    {
        var baseUrl = "https://www.code4it.dev/";
        return IsResourceAvailable(baseUrl, articlePath);
    }
    
    async Task<bool> IsResourceAvailable(string baseUrl, string articlePath)
    {
        using (HttpClient client = new HttpClient() { BaseAddress = new Uri(baseUrl) })
        {
            HttpResponseMessage response = await client.GetAsync(articlePath);
            return response.IsSuccessStatusCode;
        }
    }
    

    Notice that I removed both async and await keywords in the IsArticleAvailable and IsPathAvailable method.

    So, as you can see in this Gist, the only state machines are the ones for the Main method and for the IsResourceAvailable method.

    As usual, the more we improve memory usage, the better our applications will work.

    Other stuff

    There’s a lot more that you can improve. Look for articles that explain the correct usage of LINQ and why you should prefer HttpClientFactory over HttpClient.

    Run operations in parallel – but pay attention to the parallelism

    Let’s recap a bit what problem I needed to solve: I needed to get some details for a list of sports matches:

    Initial sequence diagram

    As you see, I perform the same set of operations for every match. Working on them in parallel improved a bit the final result.

    Sequence diagram with parallel operations

    Honestly, I was expecting a better improvement. Parallel calculation is not the silver bullet. And you should know how to implement it.

    And I still don’t know.

    After many attempts, I’ve created this class that centralizes the usage or parallel operations, so that if I find a better way to implement it, I just need to update a single class.

    Feel free to copy it or suggest improvements.

    public static class ParallelHelper
    {
        public static IEnumerable<Out> PerformInParallel<In, Out>(IEnumerable<In> items, Func<In, Out> fn, int maxDegreeOfParallelism = 10)
        {
            var options = new ParallelOptions { MaxDegreeOfParallelism = maxDegreeOfParallelism };
    
            ConcurrentBag<Out> cb = new ConcurrentBag<Out>();
    
            Parallel.ForEach(items, options, item =>
            {
                cb.Add(fn(item));
            });
            return cb.ToList();
        }
    
        public static IEnumerable<Out> PerformInParallel<In, Out>(IEnumerable<IEnumerable<In>> batches, Func<In, Out> fn, int maxDegreeOfParallelism = 10)
        {
            var options = new ParallelOptions { MaxDegreeOfParallelism = maxDegreeOfParallelism };
            ConcurrentBag<Out> cb = new ConcurrentBag<Out>();
    
            foreach (var batch in batches)
            {
                Parallel.ForEach(batch, options, item =>
                {
                    cb.Add(fn(item));
                });
            }
            return cb.ToList();
        }
    
        public static IEnumerable<Out> PerformInParallel<In, Out>(IEnumerable<IEnumerable<In>> batches, Func<IEnumerable<In>, IEnumerable<Out>> fn, int maxDegreeOfParallelism = 10)
        {
            var options = new ParallelOptions { MaxDegreeOfParallelism = maxDegreeOfParallelism };
            ConcurrentBag<Out> cb = new ConcurrentBag<Out>();
    
            Parallel.ForEach(batches, options, batch =>
                {
                    var resultValues = fn(batch).ToList();
                    foreach (var result in resultValues)
                    {
                        cb.Add(result);
                    }
                });
            return cb.ToList();
        }
    }
    

    The first method performs the operation specified in the Func on every item passed in the IEnumerable parameter: then it aggregates the result in the ConcurrentBag object (it’s a thread-safe collection) and then returns the final result.

    The other methods do a similar thing but to a list of lists: this is useful when splitting the calculation into batches and performing each of these batches in sequence.

    But, why the MaxDegreeOfParallelism? Well, resources are not infinite; you can’t perform the same heavy operation on 200000 items at the same time, even more, if many requests arrive simultaneously. You have to reduce the number of items processed in parallel.

    Parallel execution of assets

    In the picture above you can see the parallel execution of the search for assets: every call begins at the same moment, so the final timing is a lot better than if I had performed all the operations in sequence.

    Move to .NET 5

    As reported by the official documentation, there has been a huge improvement in performance in the latest version of .NET.

    Those improvements are mainly about the usage of Garbage Collector, JIT optimization, and usage of strings and Regex-s.

    If you are interested, here’s a good article on Microsoft’s blog.

    So, did it really improved my application?

    Well, no.

    As you already know, the main bottlenecks are because of external dependencies (aka API calls). So, nothing that an update of the whole framework could impact.

    But, just to try it, I moved my application from .NET Core 3.1 to .NET 5: the porting was incredibly easy. But, as I was expecting, I did not get any significant improvement.

    So, since the application was a dependency of a wider system, I rolled it back to .NET 3.1.

    Ask, discuss, communicate

    The last tip is one of the most simple yet effective ones: talk with your colleagues, keep track of what worked and what didn’t, and communicate with other developers and managers.

    Even if a question is silly, ask. Maybe you’ll find some tip that gives you the best idea.

    Have a call with your colleagues, share your code and let them help you: even a simple trick, a tool they can suggest, an article that solves one of your problems, can be the key to the success.

    Don’t expect any silver bullet: you’ll improve your application with small steps.

    Wrapping up

    We’ve seen how I managed to improve the performance of an API endpoint passing from 14 seconds to 3.

    In this article you’ve seen some .NET-related tips to improve the performance of your applications: nothing fancy, but those little steps might help you reach the desired result.

    Of course, there is more: if you are want to know how compression algorithms and hosting models affect your applications, check out this article!

    If you have more tips, feel free to share them in the comments session!

    Happy coding!


    Source link

  • performance or clean code? | Code4IT


    In any application, writing code that is clean and performant is crucial. But we often can’t have both. What to choose?

    Table of Contents

    Just a second! 🫷
    If you are here, it means that you are a software developer.
    So, you know that storage, networking, and domain management have a cost .

    If you want to support this blog, please ensure that you have disabled the adblocker for this site.
    I configured Google AdSense to show as few ADS as possible – I don’t want to bother you with lots of ads, but I still need to add some to pay for the resources for my site.

    Thank you for your understanding.
    Davide

    A few weeks ago I had a nice discussion on Twitter with Visakh Vijayan about the importance of clean code when compared to performance.

    The idea that triggered that discussion comes from a Tweet by Daniel Moka

    Wrap long conditions!

    A condition statement with multiple booleans makes your code harder to read.

    The longer a piece of code is, the more difficult it is to understand.

    It’s better to extract the condition into a well-named function that reveals the intent.

    with an example that showed how much easier is to understand an if statement when the condition evaluation is moved to a different, well-named function, rather than keeping the same condition directly in the if statement.

    So, for example:

    if(hasValidAge(user)){...}
    
    bool hasValidAge(User user)
    {
        return user.Age>= 18 && user.Age < 100;
    }
    

    is much easier to read than

    if(user.Age>= 18 && user.Age < 100){...}
    

    I totally agree with him. But then, I noticed Visakh’s point of view:

    If this thing runs in a loop, it just got a whole lot more function calls which is basically an added operation of stack push-pop.

    He’s actually right! Clearly, the way we write our code affects our application’s performance.

    So, what should be a developer’s focus? Performance or Clean code?

    In my opinion, clean code. But let’s see the different points of view.

    In favor of performance

    Obviously, an application of whichever type must be performant. Would you use prefer a slower or a faster application?

    So, we should optimize performance to the limit because:

    • every nanosecond is important
    • memory is a finite resource
    • final users are the most important users of our application

    This means that every useless stack allocation, variable, loop iteration, should be avoided. We should bring our applications to the limits.

    Another Visakh’s good point from that thread was that

    You don’t keep reading something every day … The code gets executed every day though. I would prefer performance over readability any day. Obviously with decent readability tho.

    And, again, that is true: we often write our code, test it, and never touch it again; but the application generated by our code is used every day by end-users, so our choices impact their day-by-day experience with the application.

    Visakh’s points are true. But yet I don’t agree with him. Let’s see why.

    In favor of clean code

    First of all, let’s break a myth: end user is not the final user of our code: the dev team is. A user can totally ignore how the dev team implemented their application. C#, JavaScript, Python? TDD, BDD, AOD? They will never know (unless the source code is online). So, end users are not affected by our code: they are affected by the result of the compilation of our code.

    This means that we should not write good code for them, but for ourselves.

    But, to retain users in the long run, we should focus on another aspect: maintainability.

    Given this IEEE definition of maintainability,

    a program is maintainable if it meets the following two conditions:

    • There is a high probability of determining the cause of a problem in a timely manner the first time it occurs,

    • There is a high probability of being able to modify the program without causing an error in some other part of the program.

    so, simplifying the definition, we should be able to:

    • easily identify and fix bugs
    • easily add new features

    In particular, splitting the code into different methods helps you identify bugs because:

    • the code is easier to read, as if it was a novel;
    • in C#, we can easily identify which method threw an Exception, by looking at the stack trace details.

    To demonstrate the first point, let’s read again the two snippets at the beginning of this article.

    When skimming the code, you may incur in this code:

    if(hasValidAge(user)){...}
    

    or in this one:

    if(user.Age>= 18 && user.Age < 100){...}
    

    The former gives you clearly the idea of what’s going on. If you are interested in the details, you can simply jump to the definition of hasValidAge.

    The latter forces you to understand the meaning of that condition, even if it’s not important to you – without reading it first, how would you know if it is important to you?

    And what if user was null and an exception is thrown? With the first way, the stack trace info will hint you to look at the hasValidAge method. With the second way, you have to debug the whole application to get to those breaking instructions.

    So, clean code helps you fixing bugs and then providing a more reliable application to your users.

    But they will lose some ns because of stack allocation. Do they?

    Benchmarking inline instructions vs nested methods

    The best thing to do when in doubt about performance is… to run a benchmark.

    As usual, I’ve created a benchmark with BenchmarkDotNet. I’ve already explained how to get started with it in this article, and I’ve used it to benchmark loops performances in C# in this other article.

    So, let’s see the two benchmarked methods.

    Note: those operations actually do not make any sense. They are there only to see how the stack allocation affects performance.

    The first method under test is the one with all the operations on a single level, without nested methods:

    [Benchmark]
    [ArgumentsSource(nameof(Arrays))]
    public void WithSingleLevel(int[] array)
    {
        PerformOperationsWithSingleLevel(array);
    }
    
    private void PerformOperationsWithSingleLevel(int[] array)
    {
        int[] filteredNumbers = array.Where(n => n % 12 != 0).ToArray();
    
        foreach (var number in filteredNumbers)
        {
            string status = "";
            var isOnDb = number % 3 == 0;
            if (isOnDb)
            {
                status = "onDB";
            }
            else
            {
                var isOnCache = (number + 1) % 7 == 0;
                if (isOnCache)
                {
                    status = "onCache";
                }
                else
                {
                    status = "toBeCreated";
                }
            }
        }
    }
    

    No additional calls, no stack allocations.

    The other method under test does the same thing, but exaggerating the method calls:

    
    [Benchmark]
    [ArgumentsSource(nameof(Arrays))]
    public void WithNestedLevels(int[] array)
    {
        PerformOperationsWithMultipleLevels(array);
    }
    
    private void PerformOperationsWithMultipleLevels(int[] array)
    {
        int[] filteredNumbers = GetFilteredNumbers(array);
    
        foreach (var number in filteredNumbers)
        {
            CalculateStatus(number);
        }
    }
    
    private static void CalculateStatus(int number)
    {
        string status = "";
        var isOnDb = IsOnDb(number);
        status = isOnDb ? GetOnDBStatus() : GetNotOnDbStatus(number);
    }
    
    private static string GetNotOnDbStatus(int number)
    {
        var isOnCache = IsOnCache(number);
        return isOnCache ? GetOnCacheStatus() : GetToBeCreatedStatus();
    }
    
    private static string GetToBeCreatedStatus() => "toBeCreated";
    
    private static string GetOnCacheStatus() => "onCache";
    
    private static bool IsOnCache(int number) => (number + 1) % 7 == 0;
    
    private static string GetOnDBStatus() => "onDB";
    
    private static bool IsOnDb(int number) => number % 3 == 0;
    
    private static int[] GetFilteredNumbers(int[] array) => array.Where(n => n % 12 != 0).ToArray();
    

    Almost everything is a function.

    And here’s the result of that benchmark:

    Method array Mean Error StdDev Median
    WithSingleLevel Int32[10000] 46,384.6 ns 773.95 ns 1,997.82 ns 45,605.9 ns
    WithNestedLevels Int32[10000] 58,912.2 ns 1,152.96 ns 1,539.16 ns 58,536.7 ns
    WithSingleLevel Int32[1000] 5,184.9 ns 100.54 ns 89.12 ns 5,160.7 ns
    WithNestedLevels Int32[1000] 6,557.1 ns 128.84 ns 153.37 ns 6,529.2 ns
    WithSingleLevel Int32[100] 781.0 ns 18.54 ns 51.99 ns 764.3 ns
    WithNestedLevels Int32[100] 910.5 ns 17.03 ns 31.98 ns 901.5 ns
    WithSingleLevel Int32[10] 186.7 ns 3.71 ns 9.43 ns 182.9 ns
    WithNestedLevels Int32[10] 193.5 ns 2.48 ns 2.07 ns 193.7 ns

    As you see, by increasing the size of the input array, the difference between using nested levels and staying on a single level increases too.

    But for arrays with 10 items, the difference is 7 nanoseconds (0.000000007 seconds).

    For arrays with 10000 items, the difference is 12528 nanoseconds (0.000012528 seconds).

    I don’t think the end user will ever notice that every operation is performed without calling nested methods. But the developer that has to maintain the code, he surely will.

    Conclusion

    As always, we must find a balance between clean code and performance: you should not write an incredibly elegant piece of code that takes 3 seconds to complete an operation that, using a dirtier approach, would have taken a bunch of milliseconds.

    Also, remember that the quality of the code affects the dev team, which must maintain that code. If the application uses every ns available, but it’s full of bugs, users will surely complain (and stop using it).

    So, write code for your future self and for your team, not for the average user.

    Of course, that is my opinion. Drop a message in the comment section, or reach me on Twitter!

    Happy coding!
    🐧


    Source link

  • use Miniprofiler instead of Stopwatch to profile code performance &vert; Code4IT

    use Miniprofiler instead of Stopwatch to profile code performance | Code4IT


    Just a second! 🫷
    If you are here, it means that you are a software developer.
    So, you know that storage, networking, and domain management have a cost .

    If you want to support this blog, please ensure that you have disabled the adblocker for this site.
    I configured Google AdSense to show as few ADS as possible – I don’t want to bother you with lots of ads, but I still need to add some to pay for the resources for my site.

    Thank you for your understanding.
    Davide

    Do you need to tune up the performance of your code? You can create some StopWatch objects and store the execution times or rely on external libraries like MiniProfiler.

    Note: of course, we’re just talking about time duration, and not about memory usage!

    How to profile code using Stopwatch

    A Stopwatch object acts as a (guess what?) stopwatch.

    You can manually make it start and stop, and keep track of the elapsed time:

    Stopwatch sw = Stopwatch.StartNew();
    DoSomeOperations(100);
    var with100 = sw.ElapsedMilliseconds;
    
    
    sw.Restart();
    DoSomeOperations(2000);
    var with2000 = sw.ElapsedMilliseconds;
    
    sw.Stop();
    
    Console.WriteLine($"With 100: {with100}ms");
    Console.WriteLine($"With 2000: {with2000}ms");
    

    It’s useful, but you have to do it manually. There’s a better choice.

    How to profile code using MiniProfiler

    A good alternative is MiniProfiler: you can create a MiniProfiler object that holds all the info related to the current code execution. You then can add some Steps, which can have a name, and even nest them.

    Finally, you can print the result using RenderPlainText.

    MiniProfiler profiler = MiniProfiler.StartNew();
    
    using (profiler.Step("With 100"))
    {
        DoSomeOperations(100);
    }
    
    
    using (profiler.Step("With 2000"))
    {
        DoSomeOperations(2000);
    }
    
    Console.WriteLine(profiler.RenderPlainText());
    

    You won’t anymore stop and start any StopWatch instance.

    You can even use inline steps, to profile method execution and store its return value:

    var value = profiler.Inline(() => MethodThatReturnsSomething(12), "Get something");
    

    Here I decided to print the result on the Console. You can even create HTML reports, which are quite useful when profiling websites. You can read more here, where I experimented with MiniProfiler in a .NET API project.

    Here’s an example of what you can get:

    MiniProfiler API report

    Further readings

    We’ve actually already talked about MiniProfiler in an in-depth article you can find here:

    🔗 Profiling .NET code with MiniProfiler | Code4IT

    Which, oddly, is almost more detailed than the official documentation, that you can still find here:

    🔗 MiniProfiler for .NET | MiniProfiler

    Happy coding!

    🐧


    Source link

  • Initialize lists size to improve performance &vert; Code4IT

    Initialize lists size to improve performance | Code4IT


    Lists have an inner capacity. Every time you add more items than the current Capacity, you add performance overhead. How to prevent it?

    Table of Contents

    Just a second! 🫷
    If you are here, it means that you are a software developer.
    So, you know that storage, networking, and domain management have a cost .

    If you want to support this blog, please ensure that you have disabled the adblocker for this site.
    I configured Google AdSense to show as few ADS as possible – I don’t want to bother you with lots of ads, but I still need to add some to pay for the resources for my site.

    Thank you for your understanding.
    Davide

    Some collections, like List<T>, have a predefined initial size.

    Every time you add a new item to the collection, there are two scenarios:

    1. the collection has free space, allocated but not yet populated, so adding an item is immediate;
    2. the collection is already full: internally, .NET resizes the collection, so that the next time you add a new item, we fall back to option #1.

    Clearly, the second approach has an impact on the overall performance. Can we prove it?

    Here’s a benchmark that you can run using BenchmarkDotNet:

    [Params(2, 100, 1000, 10000, 100_000)]
    public int Size;
    
    [Benchmark]
    public void SizeDefined()
    {
        int itemsCount = Size;
    
        List<int> set = new List<int>(itemsCount);
        foreach (var i in Enumerable.Range(0, itemsCount))
        {
            set.Add(i);
        }
    }
    
    [Benchmark]
    public void SizeNotDefined()
    {
        int itemsCount = Size;
    
        List<int> set = new List<int>();
        foreach (var i in Enumerable.Range(0, itemsCount))
        {
            set.Add(i);
        }
    }
    

    Those two methods are almost identical: the only difference is that in one method we specify the initial size of the list: new List<int>(itemsCount).

    Have a look at the result of the benchmark run with .NET 7:

    Method Size Mean Error StdDev Median Gen0 Gen1 Gen2 Allocated
    SizeDefined 2 49.50 ns 1.039 ns 1.678 ns 49.14 ns 0.0248 104 B
    SizeNotDefined 2 63.66 ns 3.016 ns 8.507 ns 61.99 ns 0.0268 112 B
    SizeDefined 100 798.44 ns 15.259 ns 32.847 ns 790.23 ns 0.1183 496 B
    SizeNotDefined 100 1,057.29 ns 42.100 ns 121.469 ns 1,056.42 ns 0.2918 1224 B
    SizeDefined 1000 9,180.34 ns 496.521 ns 1,400.446 ns 8,965.82 ns 0.9766 4096 B
    SizeNotDefined 1000 9,720.66 ns 406.184 ns 1,184.857 ns 9,401.37 ns 2.0142 8464 B
    SizeDefined 10000 104,645.87 ns 7,636.303 ns 22,395.954 ns 99,032.68 ns 9.5215 1.0986 40096 B
    SizeNotDefined 10000 95,192.82 ns 4,341.040 ns 12,524.893 ns 92,824.50 ns 31.2500 131440 B
    SizeDefined 100000 1,416,074.69 ns 55,800.034 ns 162,771.317 ns 1,402,166.02 ns 123.0469 123.0469 123.0469 400300 B
    SizeNotDefined 100000 1,705,672.83 ns 67,032.839 ns 186,860.763 ns 1,621,602.73 ns 285.1563 285.1563 285.1563 1049485 B

    Notice that, in general, they execute in a similar amount of time; for instance when running the same method with 100000 items, we have the same magnitude of time execution: 1,416,074.69 ns vs 1,705,672.83 ns.

    The huge difference is with the allocated space: 400,300 B vs 1,049,485 B. Almost 2.5 times better!

    Ok, it works. Next question: How can we check a List capacity?

    We’ve just learned that capacity impacts the performance of a List.

    How can you try it live? Easy: have a look at the Capacity property!

    List<int> myList = new List<int>();
    
    foreach (var element in Enumerable.Range(0,50))
    {
        myList.Add(element);
        Console.WriteLine($"Items count: {myList.Count} - List capacity: {myList.Capacity}");
    }
    

    If you run this method, you’ll see this output:

    Items count: 1 - List capacity: 4
    Items count: 2 - List capacity: 4
    Items count: 3 - List capacity: 4
    Items count: 4 - List capacity: 4
    Items count: 5 - List capacity: 8
    Items count: 6 - List capacity: 8
    Items count: 7 - List capacity: 8
    Items count: 8 - List capacity: 8
    Items count: 9 - List capacity: 16
    Items count: 10 - List capacity: 16
    Items count: 11 - List capacity: 16
    Items count: 12 - List capacity: 16
    Items count: 13 - List capacity: 16
    Items count: 14 - List capacity: 16
    Items count: 15 - List capacity: 16
    Items count: 16 - List capacity: 16
    Items count: 17 - List capacity: 32
    Items count: 18 - List capacity: 32
    Items count: 19 - List capacity: 32
    Items count: 20 - List capacity: 32
    Items count: 21 - List capacity: 32
    Items count: 22 - List capacity: 32
    Items count: 23 - List capacity: 32
    Items count: 24 - List capacity: 32
    Items count: 25 - List capacity: 32
    Items count: 26 - List capacity: 32
    Items count: 27 - List capacity: 32
    Items count: 28 - List capacity: 32
    Items count: 29 - List capacity: 32
    Items count: 30 - List capacity: 32
    Items count: 31 - List capacity: 32
    Items count: 32 - List capacity: 32
    Items count: 33 - List capacity: 64
    Items count: 34 - List capacity: 64
    Items count: 35 - List capacity: 64
    Items count: 36 - List capacity: 64
    Items count: 37 - List capacity: 64
    Items count: 38 - List capacity: 64
    Items count: 39 - List capacity: 64
    Items count: 40 - List capacity: 64
    Items count: 41 - List capacity: 64
    Items count: 42 - List capacity: 64
    Items count: 43 - List capacity: 64
    Items count: 44 - List capacity: 64
    Items count: 45 - List capacity: 64
    Items count: 46 - List capacity: 64
    Items count: 47 - List capacity: 64
    Items count: 48 - List capacity: 64
    Items count: 49 - List capacity: 64
    Items count: 50 - List capacity: 64
    

    So, as you can see, List capacity is doubled every time the current capacity is not enough.

    Further readings

    To populate the lists in our Benchmarks we used Enumerable.Range. Do you know how it works? Have a look at this C# tip:

    🔗 C# Tip: LINQ’s Enumerable.Range to generate a sequence of consecutive numbers

    This article first appeared on Code4IT 🐧

    Wrapping up

    In this article, we’ve learned that just a minimal change can impact our application performance.

    We simply used a different constructor, but the difference is astounding. Clearly, this trick works only if already know the final length of the list (or, at least, an estimation). The more precise, the better!

    I hope you enjoyed this article! Let’s keep in touch on Twitter or on LinkedIn, if you want! 🤜🤛

    Happy coding!

    🐧


    Source link

  • Top 6 Performance Tips when dealing with strings in C# 12 and .NET 8 &vert; Code4IT

    Top 6 Performance Tips when dealing with strings in C# 12 and .NET 8 | Code4IT


    Small changes sometimes make a huge difference. Learn these 6 tips to improve the performance of your application just by handling strings correctly.

    Table of Contents

    Just a second! 🫷
    If you are here, it means that you are a software developer.
    So, you know that storage, networking, and domain management have a cost .

    If you want to support this blog, please ensure that you have disabled the adblocker for this site.
    I configured Google AdSense to show as few ADS as possible – I don’t want to bother you with lots of ads, but I still need to add some to pay for the resources for my site.

    Thank you for your understanding.
    Davide

    Sometimes, just a minor change makes a huge difference. Maybe you won’t notice it when performing the same operation a few times. Still, the improvement is significant when repeating the operation thousands of times.

    In this article, we will learn five simple tricks to improve the performance of your application when dealing with strings.

    Note: this article is part of C# Advent Calendar 2023, organized by Matthew D. Groves: it’s maybe the only Christmas tradition I like (yes, I’m kind of a Grinch 😂).

    Benchmark structure, with dependencies

    Before jumping to the benchmarks, I want to spend a few words on the tools I used for this article.

    The project is a .NET 8 class library running on a laptop with an i5 processor.

    Running benchmarks with BenchmarkDotNet

    I’m using BenchmarkDotNet to create benchmarks for my code. BenchmarkDotNet is a library that runs your methods several times, captures some metrics, and generates a report of the executions. If you follow my blog, you might know I’ve used it several times – for example, in my old article “Enum.HasFlag performance with BenchmarkDotNet”.

    All the benchmarks I created follow the same structure:

    [MemoryDiagnoser]
    public class BenchmarkName()
    {
        [Params(1, 5, 10)] // clearly, I won't use these values
        public int Size;
    
        public string[] AllStrings { get; set; }
    
        [IterationSetup]
        public void Setup()
        {
            AllStrings = StringArrayGenerator.Generate(Size, "hello!", "HELLO!");
        }
    
        [Benchmark(Baseline=true)]
        public void FirstMethod()
        {
            //omitted
        }
    
        [Benchmark]
        public void SecondMethod()
        {
            //omitted
        }
    }
    

    In short:

    • the class is marked with the [MemoryDiagnoser] attribute: the benchmark will retrieve info for both time and memory usage;
    • there is a property named Size with the attribute [Params]: this attribute lists the possible values for the Size property;
    • there is a method marked as [IterationSetup]: this method runs before every single execution, takes the value from the Size property, and initializes the AllStrings array;
    • the methods that are parts of the benchmark are marked with the [Benchmark] attribute.

    Generating strings with Bogus

    I relied on Bogus to create dummy values. This NuGet library allows you to generate realistic values for your objects with a great level of customization.

    The string array generation strategy is shared across all the benchmarks, so I moved it to a static method:

     public static class StringArrayGenerator
     {
         public static string[] Generate(int size, params string[] additionalStrings)
         {
             string[] array = new string[size];
             Faker faker = new Faker();
    
             List<string> fixedValues = [
                 string.Empty,
                 "   ",
                 "\n  \t",
                 null
             ];
    
             if (additionalStrings != null)
                 fixedValues.AddRange(additionalStrings);
    
             for (int i = 0; i < array.Length; i++)
             {
                 if (Random.Shared.Next() % 4 == 0)
                 {
                     array[i] = Random.Shared.GetItems<string>(fixedValues.ToArray(), 1).First();
                 }
                 else
                 {
                     array[i] = faker.Lorem.Word();
                 }
             }
    
             return array;
         }
     }
    

    Here I have a default set of predefined values ([string.Empty, " ", "\n \t", null]), which can be expanded with the values coming from the additionalStrings array. These values are then placed in random positions of the array.

    In most cases, though, the value of the string is defined by Bogus.

    Generating plots with chartbenchmark.net

    To generate the plots you will see in this article, I relied on chartbenchmark.net, a fantastic tool that transforms the output generated by BenchmarkDotNet on the console in a dynamic, customizable plot. This tool created by Carlos Villegas is available on GitHub, and it surely deserves a star!

    Please note that all the plots in this article have a Log10 scale: this scale allows me to show you the performance values of all the executions in the same plot. If I used the Linear scale, you would be able to see only the biggest values.

    We are ready. It’s time to run some benchmarks!

    Tip #1: StringBuilder is (almost always) better than String Concatenation

    Let’s start with a simple trick: if you need to concatenate strings, using a StringBuilder is generally more efficient than concatenating string.

    [MemoryDiagnoser]
    public class StringBuilderVsConcatenation()
    {
        [Params(4, 100, 10_000, 100_000)]
        public int Size;
    
        public string[] AllStrings { get; set; }
    
        [IterationSetup]
        public void Setup()
        {
            AllStrings = StringArrayGenerator.Generate(Size, "hello!", "HELLO!");
        }
    
        [Benchmark]
        public void WithStringBuilder()
        {
            StringBuilder sb = new StringBuilder();
    
            foreach (string s in AllStrings)
            {
                sb.Append(s);
            }
    
            var finalString = sb.ToString();
        }
    
        [Benchmark]
        public void WithConcatenation()
        {
            string finalString = "";
            foreach (string s in AllStrings)
            {
                finalString += s;
            }
        }
    }
    

    Whenever you concatenate strings with the + sign, you create a new instance of a string. This operation takes some time and allocates memory for every operation.

    On the contrary, using a StringBuilder object, you can add the strings in memory and generate the final string using a performance-wise method.

    Here’s the result table:

    Method Size Mean Error StdDev Median Ratio RatioSD Allocated Alloc Ratio
    WithStringBuilder 4 4.891 us 0.5568 us 1.607 us 4.750 us 1.00 0.00 1016 B 1.00
    WithConcatenation 4 3.130 us 0.4517 us 1.318 us 2.800 us 0.72 0.39 776 B 0.76
    WithStringBuilder 100 7.649 us 0.6596 us 1.924 us 7.650 us 1.00 0.00 4376 B 1.00
    WithConcatenation 100 13.804 us 1.1970 us 3.473 us 13.800 us 1.96 0.82 51192 B 11.70
    WithStringBuilder 10000 113.091 us 4.2106 us 12.081 us 111.000 us 1.00 0.00 217200 B 1.00
    WithConcatenation 10000 74,512.259 us 2,111.4213 us 6,058.064 us 72,593.050 us 666.43 91.44 466990336 B 2,150.05
    WithStringBuilder 100000 1,037.523 us 37.1009 us 108.225 us 1,012.350 us 1.00 0.00 2052376 B 1.00
    WithConcatenation 100000 7,469,344.914 us 69,720.9843 us 61,805.837 us 7,465,779.900 us 7,335.08 787.44 46925872520 B 22,864.17

    Let’s see it as a plot.

    Beware of the scale in the diagram!: it’s a Log10 scale, so you’d better have a look at the value displayed on the Y-axis.

    StringBuilder vs string concatenation in C#: performance benchmark

    As you can see, there is a considerable performance improvement.

    There are some remarkable points:

    1. When there are just a few strings to concatenate, the + operator is more performant, both on timing and allocated memory;
    2. When you need to concatenate 100000 strings, the concatenation is ~7000 times slower than the string builder.

    In conclusion, use the StringBuilder to concatenate more than 5 or 6 strings. Use the string concatenation for smaller operations.

    Edit 2024-01-08: turn out that string.Concat has an overload that accepts an array of strings. string.Concat(string[]) is actually faster than using the StringBuilder. Read more this article by Robin Choffardet.

    Tip #2: EndsWith(string) vs EndsWith(char): pick the right overload

    One simple improvement can be made if you use StartsWith or EndsWith, passing a single character.

    There are two similar overloads: one that accepts a string, and one that accepts a char.

    [MemoryDiagnoser]
    public class EndsWithStringVsChar()
    {
        [Params(100, 1000, 10_000, 100_000, 1_000_000)]
        public int Size;
    
        public string[] AllStrings { get; set; }
    
        [IterationSetup]
        public void Setup()
        {
            AllStrings = StringArrayGenerator.Generate(Size);
        }
    
        [Benchmark(Baseline = true)]
        public void EndsWithChar()
        {
        foreach (string s in AllStrings)
        {
            _ = s?.EndsWith('e');
        }
        }
    
        [Benchmark]
        public void EndsWithString()
        {
        foreach (string s in AllStrings)
        {
            _ = s?.EndsWith("e");
        }
        }
    }
    

    We have the following results:

    Method Size Mean Error StdDev Median Ratio
    EndsWithChar 100 2.189 us 0.2334 us 0.6771 us 2.150 us 1.00
    EndsWithString 100 5.228 us 0.4495 us 1.2970 us 5.050 us 2.56
    EndsWithChar 1000 12.796 us 1.2006 us 3.4831 us 12.200 us 1.00
    EndsWithString 1000 30.434 us 1.8783 us 5.4492 us 29.250 us 2.52
    EndsWithChar 10000 25.462 us 2.0451 us 5.9658 us 23.950 us 1.00
    EndsWithString 10000 251.483 us 18.8300 us 55.2252 us 262.300 us 10.48
    EndsWithChar 100000 209.776 us 18.7782 us 54.1793 us 199.900 us 1.00
    EndsWithString 100000 826.090 us 44.4127 us 118.5465 us 781.650 us 4.14
    EndsWithChar 1000000 2,199.463 us 74.4067 us 217.0480 us 2,190.600 us 1.00
    EndsWithString 1000000 7,506.450 us 190.7587 us 562.4562 us 7,356.250 us 3.45

    Again, let’s generate the plot using the Log10 scale:

    EndsWith(char) vs EndsWith(string) in C# performance benchmark

    They appear to be almost identical, but look closely: based on this benchmark, when we have 10000, using EndsWith(string) is 10x slower than EndsWith(char).

    Also, here, the duration ratio on the 1.000.000-items array is ~3.5. At first, I thought there was an error on the benchmark, but when rerunning it on the benchmark, the ratio did not change.

    It looks like you have the best improvement ratio when the array has ~10.000 items.

    Tip #3: IsNullOrEmpty vs IsNullOrWhitespace vs IsNullOrEmpty + Trim

    As you might know, string.IsNullOrWhiteSpace performs stricter checks than string.IsNullOrEmpty.

    (If you didn’t know, have a look at this quick explanation of the cases covered by these methods).

    Does it affect performance?

    To demonstrate it, I have created three benchmarks: one for string.IsNullOrEmpty, one for string.IsNullOrWhiteSpace, and another one that lays in between: it first calls Trim() on the string, and then calls string.IsNullOrEmpty.

    [MemoryDiagnoser]
    public class StringEmptyBenchmark
    {
        [Params(100, 1000, 10_000, 100_000, 1_000_000)]
        public int Size;
    
        public string[] AllStrings { get; set; }
    
        [IterationSetup]
        public void Setup()
        {
            AllStrings = StringArrayGenerator.Generate(Size);
        }
    
        [Benchmark(Baseline = true)]
        public void StringIsNullOrEmpty()
        {
            foreach (string s in AllStrings)
            {
                _ = string.IsNullOrEmpty(s);
            }
        }
    
        [Benchmark]
        public void StringIsNullOrEmptyWithTrim()
        {
            foreach (string s in AllStrings)
            {
                _ = string.IsNullOrEmpty(s?.Trim());
            }
        }
    
        [Benchmark]
        public void StringIsNullOrWhitespace()
        {
            foreach (string s in AllStrings)
            {
                _ = string.IsNullOrWhiteSpace(s);
            }
        }
    }
    

    We have the following values:

    Method Size Mean Error StdDev Ratio
    StringIsNullOrEmpty 100 1.723 us 0.2302 us 0.6715 us 1.00
    StringIsNullOrEmptyWithTrim 100 2.394 us 0.3525 us 1.0282 us 1.67
    StringIsNullOrWhitespace 100 2.017 us 0.2289 us 0.6604 us 1.45
    StringIsNullOrEmpty 1000 10.885 us 1.3980 us 4.0781 us 1.00
    StringIsNullOrEmptyWithTrim 1000 20.450 us 1.9966 us 5.8240 us 2.13
    StringIsNullOrWhitespace 1000 13.160 us 1.0851 us 3.1482 us 1.34
    StringIsNullOrEmpty 10000 18.717 us 1.1252 us 3.2464 us 1.00
    StringIsNullOrEmptyWithTrim 10000 52.786 us 1.2208 us 3.5222 us 2.90
    StringIsNullOrWhitespace 10000 46.602 us 1.2363 us 3.4668 us 2.54
    StringIsNullOrEmpty 100000 168.232 us 12.6948 us 36.0129 us 1.00
    StringIsNullOrEmptyWithTrim 100000 439.744 us 9.3648 us 25.3182 us 2.71
    StringIsNullOrWhitespace 100000 394.310 us 7.8976 us 20.5270 us 2.42
    StringIsNullOrEmpty 1000000 2,074.234 us 64.3964 us 186.8257 us 1.00
    StringIsNullOrEmptyWithTrim 1000000 4,691.103 us 112.2382 us 327.4040 us 2.28
    StringIsNullOrWhitespace 1000000 4,198.809 us 83.6526 us 161.1702 us 2.04

    As you can see from the Log10 table, the results are pretty similar:

    string.IsNullOrEmpty vs string.IsNullOrWhiteSpace vs Trim in C#: performance benchmark

    On average, StringIsNullOrWhitespace is ~2 times slower than StringIsNullOrEmpty.

    So, what should we do? Here’s my two cents:

    1. For all the data coming from the outside (passed as input to your system, received from an API call, read from the database), use string.IsNUllOrWhiteSpace: this way you can ensure that you are not receiving unexpected data;
    2. If you read data from an external API, customize your JSON deserializer to convert whitespace strings as empty values;
    3. Needless to say, choose the proper method depending on the use case. If a string like “\n \n \t” is a valid value for you, use string.IsNullOrEmpty.

    Tip #4: ToUpper vs ToUpperInvariant vs ToLower vs ToLowerInvariant: they look similar, but they are not

    Even though they look similar, there is a difference in terms of performance between these four methods.

    [MemoryDiagnoser]
    public class ToUpperVsToLower()
    {
        [Params(100, 1000, 10_000, 100_000, 1_000_000)]
        public int Size;
    
        public string[] AllStrings { get; set; }
    
        [IterationSetup]
        public void Setup()
        {
            AllStrings = StringArrayGenerator.Generate(Size);
        }
    
        [Benchmark]
        public void WithToUpper()
        {
            foreach (string s in AllStrings)
            {
                _ = s?.ToUpper();
            }
        }
    
        [Benchmark]
        public void WithToUpperInvariant()
        {
            foreach (string s in AllStrings)
            {
                _ = s?.ToUpperInvariant();
            }
        }
    
        [Benchmark]
        public void WithToLower()
        {
            foreach (string s in AllStrings)
            {
                _ = s?.ToLower();
            }
        }
    
        [Benchmark]
        public void WithToLowerInvariant()
        {
            foreach (string s in AllStrings)
            {
                _ = s?.ToLowerInvariant();
            }
        }
    }
    

    What will this benchmark generate?

    Method Size Mean Error StdDev Median P95 Ratio
    WithToUpper 100 9.153 us 0.9720 us 2.789 us 8.200 us 14.980 us 1.57
    WithToUpperInvariant 100 6.572 us 0.5650 us 1.639 us 6.200 us 9.400 us 1.14
    WithToLower 100 6.881 us 0.5076 us 1.489 us 7.100 us 9.220 us 1.19
    WithToLowerInvariant 100 6.143 us 0.5212 us 1.529 us 6.100 us 8.400 us 1.00
    WithToUpper 1000 69.776 us 9.5416 us 27.833 us 68.650 us 108.815 us 2.60
    WithToUpperInvariant 1000 51.284 us 7.7945 us 22.860 us 38.700 us 89.290 us 1.85
    WithToLower 1000 49.520 us 5.6085 us 16.449 us 48.100 us 79.110 us 1.85
    WithToLowerInvariant 1000 27.000 us 0.7370 us 2.103 us 26.850 us 30.375 us 1.00
    WithToUpper 10000 241.221 us 4.0480 us 3.588 us 240.900 us 246.560 us 1.68
    WithToUpperInvariant 10000 339.370 us 42.4036 us 125.028 us 381.950 us 594.760 us 1.48
    WithToLower 10000 246.861 us 15.7924 us 45.565 us 257.250 us 302.875 us 1.12
    WithToLowerInvariant 10000 143.529 us 2.1542 us 1.910 us 143.500 us 146.105 us 1.00
    WithToUpper 100000 2,165.838 us 84.7013 us 223.137 us 2,118.900 us 2,875.800 us 1.66
    WithToUpperInvariant 100000 1,885.329 us 36.8408 us 63.548 us 1,894.500 us 1,967.020 us 1.41
    WithToLower 100000 1,478.696 us 23.7192 us 50.547 us 1,472.100 us 1,571.330 us 1.10
    WithToLowerInvariant 100000 1,335.950 us 18.2716 us 35.203 us 1,330.100 us 1,404.175 us 1.00
    WithToUpper 1000000 20,936.247 us 414.7538 us 1,163.014 us 20,905.150 us 22,928.350 us 1.64
    WithToUpperInvariant 1000000 19,056.983 us 368.7473 us 287.894 us 19,085.400 us 19,422.880 us 1.41
    WithToLower 1000000 14,266.714 us 204.2906 us 181.098 us 14,236.500 us 14,593.035 us 1.06
    WithToLowerInvariant 1000000 13,464.127 us 266.7547 us 327.599 us 13,511.450 us 13,926.495 us 1.00

    Let’s see it as the usual Log10 plot:

    ToUpper vs ToLower comparison in C#: performance benchmark

    We can notice a few points:

    1. The ToUpper family is generally slower than the ToLower family;
    2. The Invariant family is faster than the non-Invariant one; we will see more below;

    So, if you have to normalize strings using the same casing, ToLowerInvariant is the best choice.

    Tip #5: OrdinalIgnoreCase vs InvariantCultureIgnoreCase: logically (almost) equivalent, but with different performance

    Comparing strings is trivial: the string.Compare method is all you need.

    There are several modes to compare strings: you can specify the comparison rules by setting the comparisonType parameter, which accepts a StringComparison value.

    [MemoryDiagnoser]
    public class StringCompareOrdinalVsInvariant()
    {
        [Params(100, 1000, 10_000, 100_000, 1_000_000)]
        public int Size;
    
        public string[] AllStrings { get; set; }
    
        [IterationSetup]
        public void Setup()
        {
            AllStrings = StringArrayGenerator.Generate(Size, "hello!", "HELLO!");
        }
    
        [Benchmark(Baseline = true)]
        public void WithOrdinalIgnoreCase()
        {
            foreach (string s in AllStrings)
            {
                _ = string.Equals(s, "hello!", StringComparison.OrdinalIgnoreCase);
            }
        }
    
        [Benchmark]
        public void WithInvariantCultureIgnoreCase()
        {
            foreach (string s in AllStrings)
            {
                _ = string.Equals(s, "hello!", StringComparison.InvariantCultureIgnoreCase);
            }
        }
    }
    

    Let’s see the results:

    Method Size Mean Error StdDev Ratio
    WithOrdinalIgnoreCase 100 2.380 us 0.2856 us 0.8420 us 1.00
    WithInvariantCultureIgnoreCase 100 7.974 us 0.7817 us 2.3049 us 3.68
    WithOrdinalIgnoreCase 1000 11.316 us 0.9170 us 2.6603 us 1.00
    WithInvariantCultureIgnoreCase 1000 35.265 us 1.5455 us 4.4591 us 3.26
    WithOrdinalIgnoreCase 10000 20.262 us 1.1801 us 3.3668 us 1.00
    WithInvariantCultureIgnoreCase 10000 225.892 us 4.4945 us 12.5289 us 11.41
    WithOrdinalIgnoreCase 100000 148.270 us 11.3234 us 32.8514 us 1.00
    WithInvariantCultureIgnoreCase 100000 1,811.144 us 35.9101 us 64.7533 us 12.62
    WithOrdinalIgnoreCase 1000000 2,050.894 us 59.5966 us 173.8460 us 1.00
    WithInvariantCultureIgnoreCase 1000000 18,138.063 us 360.1967 us 986.0327 us 8.87

    As you can see, there’s a HUGE difference between Ordinal and Invariant.

    When dealing with 100.000 items, StringComparison.InvariantCultureIgnoreCase is 12 times slower than StringComparison.OrdinalIgnoreCase!

    Ordinal vs InvariantCulture comparison in C#: performance benchmark

    Why? Also, why should we use one instead of the other?

    Have a look at this code snippet:

    var s1 = "Aa";
    var s2 = "A" + new string('\u0000', 3) + "a";
    
    string.Equals(s1, s2, StringComparison.InvariantCultureIgnoreCase); //True
    string.Equals(s1, s2, StringComparison.OrdinalIgnoreCase); //False
    

    As you can see, s1 and s2 represent equivalent, but not equal, strings. We can then deduce that OrdinalIgnoreCase checks for the exact values of the characters, while InvariantCultureIgnoreCase checks the string’s “meaning”.

    So, in most cases, you might want to use OrdinalIgnoreCase (as always, it depends on your use case!)

    Tip #6: Newtonsoft vs System.Text.Json: it’s a matter of memory allocation, not time

    For the last benchmark, I created the exact same model used as an example in the official documentation.

    This benchmark aims to see which JSON serialization library is faster: Newtonsoft or System.Text.Json?

    [MemoryDiagnoser]
    public class JsonSerializerComparison
    {
        [Params(100, 10_000, 1_000_000)]
        public int Size;
        List<User?> Users { get; set; }
    
        [IterationSetup]
        public void Setup()
        {
            Users = UsersCreator.GenerateUsers(Size);
        }
    
        [Benchmark(Baseline = true)]
        public void WithJson()
        {
            foreach (User? user in Users)
            {
                var asString = System.Text.Json.JsonSerializer.Serialize(user);
    
                _ = System.Text.Json.JsonSerializer.Deserialize<User?>(asString);
            }
        }
    
        [Benchmark]
        public void WithNewtonsoft()
        {
            foreach (User? user in Users)
            {
                string asString = Newtonsoft.Json.JsonConvert.SerializeObject(user);
                _ = Newtonsoft.Json.JsonConvert.DeserializeObject<User?>(asString);
            }
        }
    }
    

    As you might know, the .NET team has added lots of performance improvements to the JSON Serialization functionalities, and you can really see the difference!

    Method Size Mean Error StdDev Median Ratio RatioSD Gen0 Gen1 Allocated Alloc Ratio
    WithJson 100 2.063 ms 0.1409 ms 0.3927 ms 1.924 ms 1.00 0.00 292.87 KB 1.00
    WithNewtonsoft 100 4.452 ms 0.1185 ms 0.3243 ms 4.391 ms 2.21 0.39 882.71 KB 3.01
    WithJson 10000 44.237 ms 0.8787 ms 1.3936 ms 43.873 ms 1.00 0.00 4000.0000 1000.0000 29374.98 KB 1.00
    WithNewtonsoft 10000 78.661 ms 1.3542 ms 2.6090 ms 78.865 ms 1.77 0.08 14000.0000 1000.0000 88440.99 KB 3.01
    WithJson 1000000 4,233.583 ms 82.5804 ms 113.0369 ms 4,202.359 ms 1.00 0.00 484000.0000 1000.0000 2965741.56 KB 1.00
    WithNewtonsoft 1000000 5,260.680 ms 101.6941 ms 108.8116 ms 5,219.955 ms 1.24 0.04 1448000.0000 1000.0000 8872031.8 KB 2.99

    As you can see, Newtonsoft is 2x slower than System.Text.Json, and it allocates 3x the memory compared with the other library.

    So, well, if you don’t use library-specific functionalities, I suggest you replace Newtonsoft with System.Text.Json.

    Wrapping up

    In this article, we learned that even tiny changes can make a difference in the long run.

    Let’s recap some:

    1. Using StringBuilder is generally WAY faster than using string concatenation unless you need to concatenate 2 to 4 strings;
    2. Sometimes, the difference is not about execution time but memory usage;
    3. EndsWith and StartsWith perform better if you look for a char instead of a string. If you think of it, it totally makes sense!
    4. More often than not, string.IsNullOrWhiteSpace performs better checks than string.IsNullOrEmpty; however, there is a huge difference in terms of performance, so you should pick the correct method depending on the usage;
    5. ToUpper and ToLower look similar; however, ToLower is quite faster than ToUpper;
    6. Ordinal and Invariant comparison return the same value for almost every input; but Ordinal is faster than Invariant;
    7. Newtonsoft performs similarly to System.Text.Json, but it allocates way more memory.

    This article first appeared on Code4IT 🐧

    My suggestion is always the same: take your time to explore the possibilities! Toy with your code, try to break it, benchmark it. You’ll find interesting takes!

    I hope you enjoyed this article! Let’s keep in touch on Twitter or LinkedIn! 🤜🤛

    Happy coding!

    🐧


    Source link