برچسب: Rive

  • Making Animations Smarter with Data Binding: Creating a Dynamic Gold Calculator in Rive

    Making Animations Smarter with Data Binding: Creating a Dynamic Gold Calculator in Rive


    Designing visuals that respond to real-time data or user input usually means switching between multiple tools — one for animation, another for logic, and yet another for implementation. This back-and-forth can slow down iteration, make small changes cumbersome, and create a disconnect between design and behavior.

    If you’ve spent any time with Rive, you know it’s built to close that gap. It lets you design, animate, and add interaction all in one place — and with features like state machines and data binding, you can make your animations respond directly to variables and user actions.

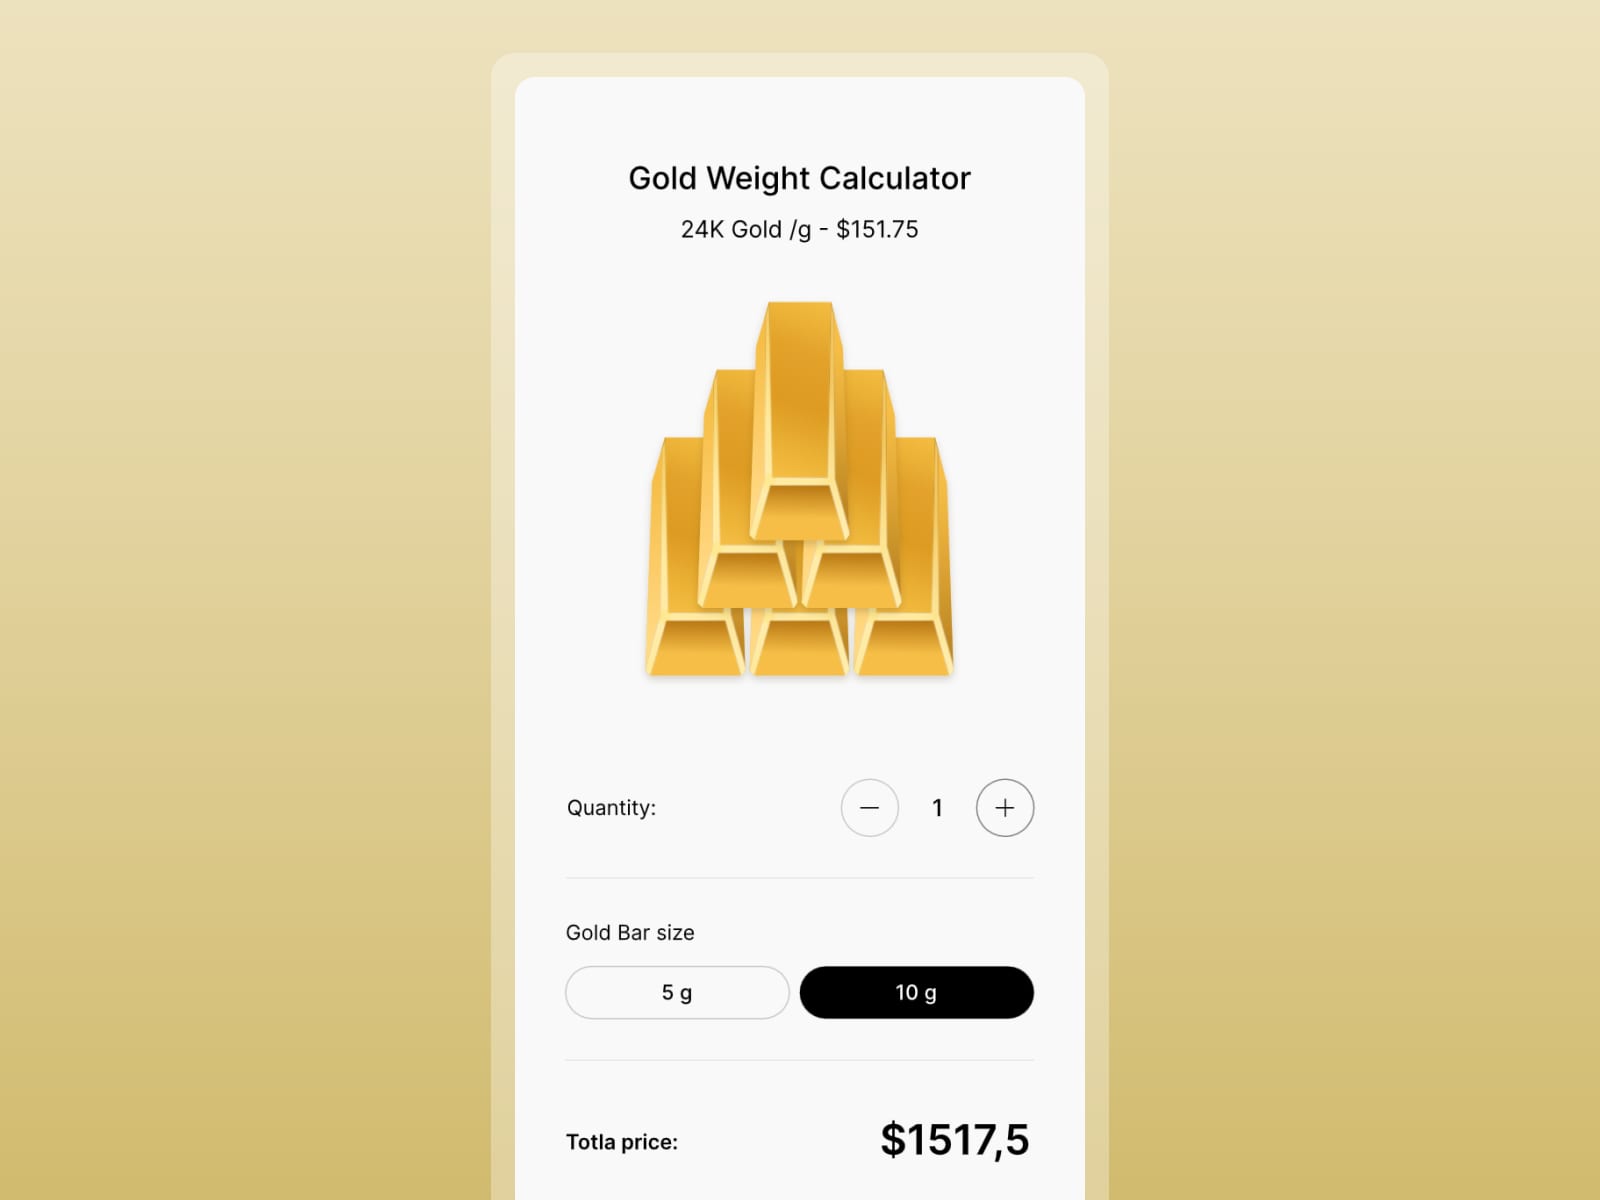
    To demonstrate how we use data binding in Rive, we built a small interactive project — a gold calculator. The task was simple: calculate the price of 5g and 10g gold bars, from 1 to 6 bars, using external data for the current gold price per gram. The gold price can be dynamic, typically coming from market data, but in this case we used a manually set value.

    Let’s break down how the calculator is built, step by step, starting with the layout and structure of the file.

    1. File Structure

    The layout is built for mobile, using a 440×900 px artboard. It’s structured around three layout groups:

    1. Title with gold price per gram
    2. Controls for choosing gold bar amount and weight
    3. Gold bar illustration

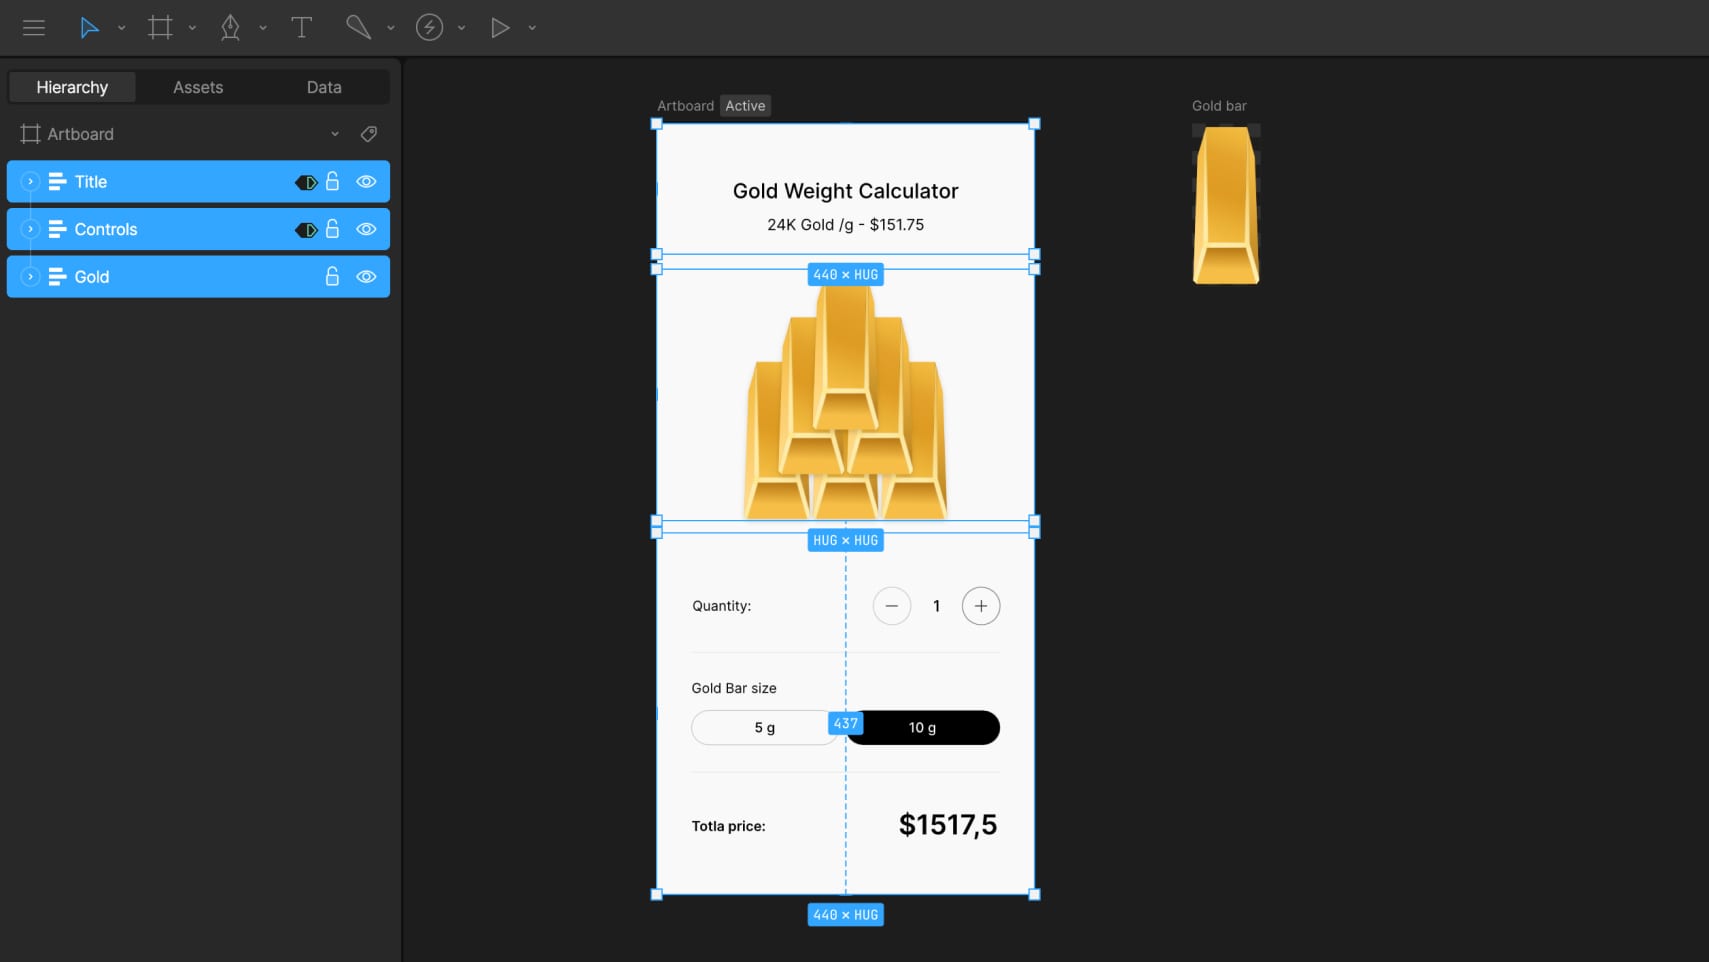
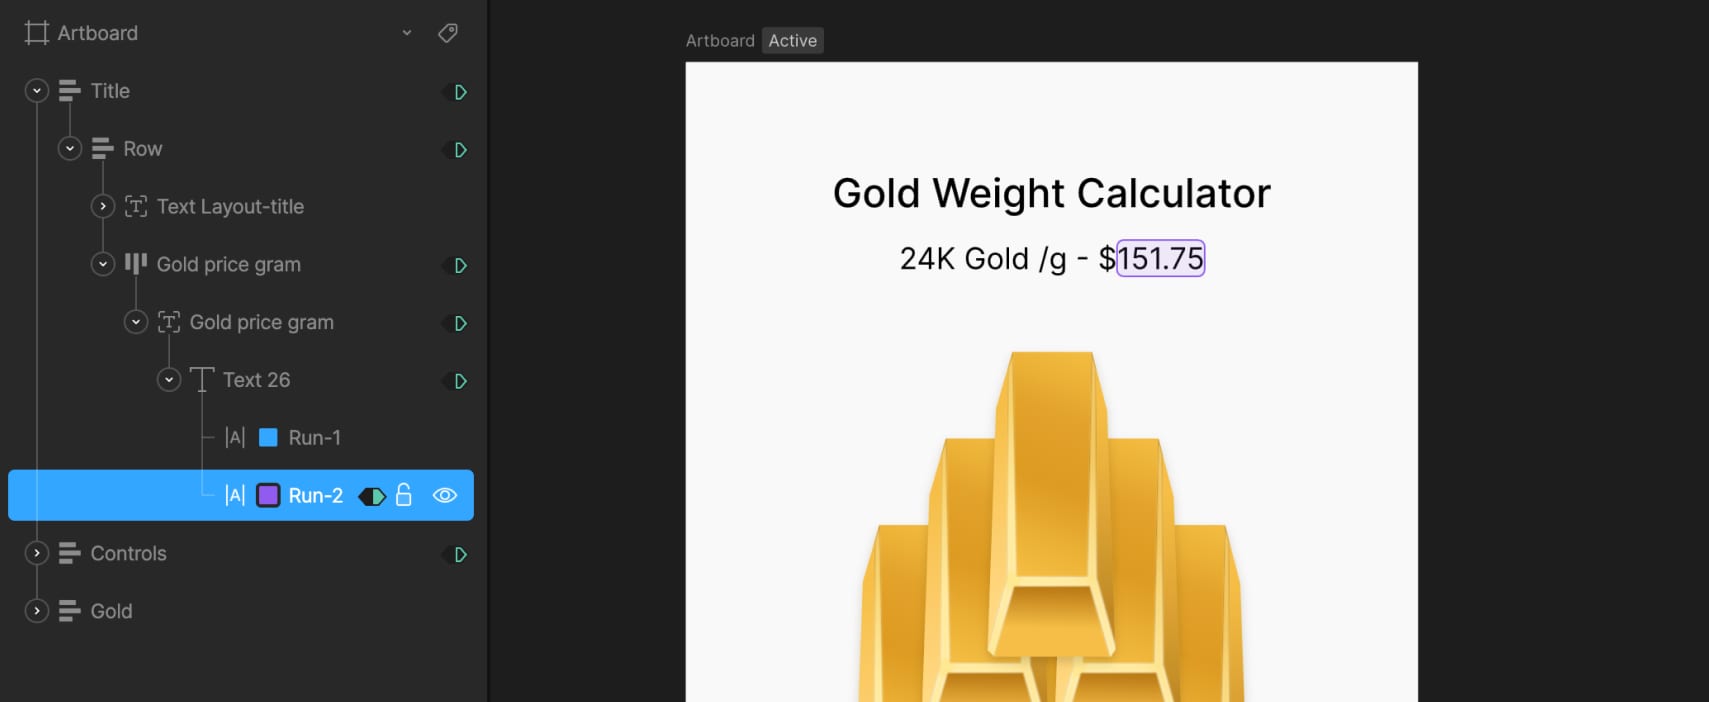
    The title section includes a text layout made of two text runs: one holds static text like the label, while the other is dynamic and connected to external data using data binding. This allows the gold price to update in real time when the data changes.

    In the controls section, we added plus and minus buttons to set the number of gold bars. These are simple layouts with icons inside. Below them, there are two buttons to switch between 5g and 10g options. They’re styled as rounded layouts with text inside.

    In the state machine, two timelines define the tab states: one for when the 10g button is active, using a solid black background and white text, and another for 5g, with reversed styles. Switching between these two updates the active tab visually.

    The total price section also uses two text runs — one for the currency icon and one for the total value. This value changes based on the selected weight and quantity, and is driven by data binding.

    2. Gold Bar Illustration

    The illustration is built using a nested artboard with a single vector gold bar. Inside the calculator layout, we duplicated this artboard to show anywhere from 1 to 6 bars depending on the user’s selection.

    Since there are two weight options, we made the gold bar resize visually — wider for 10g and narrower for 5g. To do that, we used N-Slices so that the edges stay intact and only the middle stretches. The sliced group sits inside a fixed-size layout, and the artboard is set to Hug its contents, which lets it resize automatically.

    Created two timelines to control bar size: one where the width is 88px for 10g, and another at 74px for 5g. The switch between them is controlled by a number variable called Size-gram gold, where 5g is represented by 0 and 10g by 1 with 1 set as the default value.

    In the state machine, we connected this variable to the two timelines (the 10g timeline set as the default)— when it’s set to 0, the layout switches to 5g; when it’s 1, it switches to 10g. This makes the size update based on user selection without any manual switching. To keep the transition smooth, a 150ms animation duration is added.

    3. Visualizing 1–6 Gold Bars

    To show different quantities of gold bars in the main calculator layout, we created a tiered structure using three stacked layout groups with a vertical gap -137. Each tier is offset vertically to form a simple pyramid arrangement, with everything positioned in the bottom-left corner of the screen.

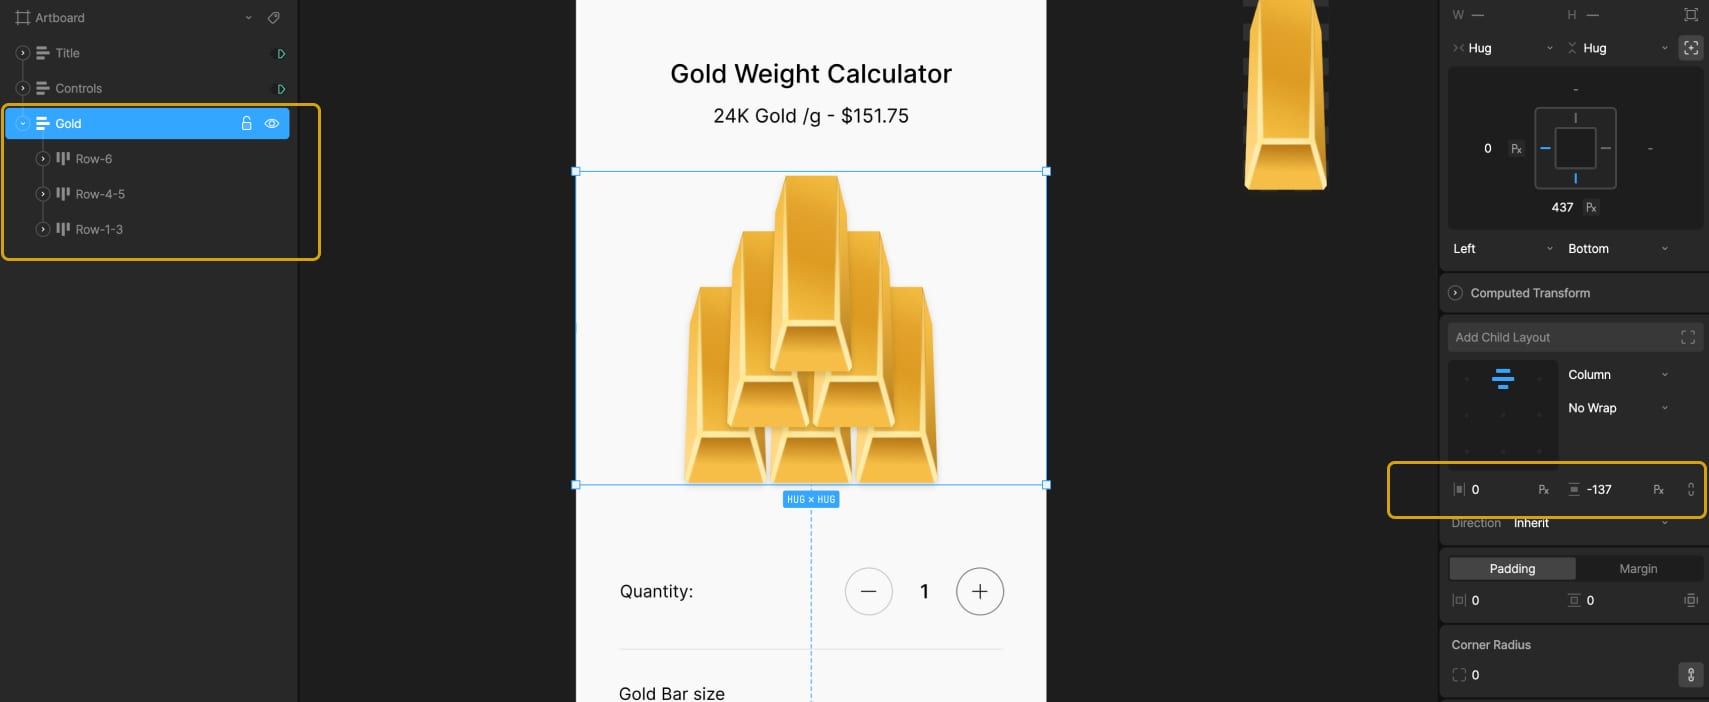
    The first tier contains three duplicated nested artboards of a single gold bar. Each of these is wrapped in a Hug layout, which allows them to resize correctly based on the weight. The second tier includes two gold bars and an empty layout. This empty layout is used for spacing — it creates a visual shift when we need to display exactly four bars. The top tier has just one gold bar centered.

    All three tiers are bottom-centered, which keeps the pyramid shape consistent as bars are added or removed.

    To control how many bars are visible, we created 6 timelines in Animate mode — one for each quantity from 1 to 6. To hide or show each gold bar, two techniques are used: adjusting the opacity of the nested artboard (100% to show, 0% to hide) and modifying the layout that wraps it. When a bar is hidden, the layout is set to a fixed width of 0px; when visible, it uses Hug settings to restore its size automatically.

    Each timeline has its own combination of these settings depending on which bars should appear. For example, in the timeline with 4 bars, we needed to prevent the fourth bar from jumping to the center of the row. To keep it properly spaced, we assigned a fixed width of 80px to the empty layout used for shifting. On the other timelines, that same layout is hidden by setting its width to 0px.

    This system makes it easy to switch between quantities while preserving the visual structure.

    4. State Machine and Data Binding Setup

    With the visuals and layouts ready, we moved on to setting up the logic with data binding and state transitions.

    4.1 External Gold Price

    First, we created a number variable called Gold price gram. This value can be updated externally — for example, connected to a trading database — so the calculator always shows the current market price of gold. In our case, we used a static value of 151.75, which can also be updated manually by the user.

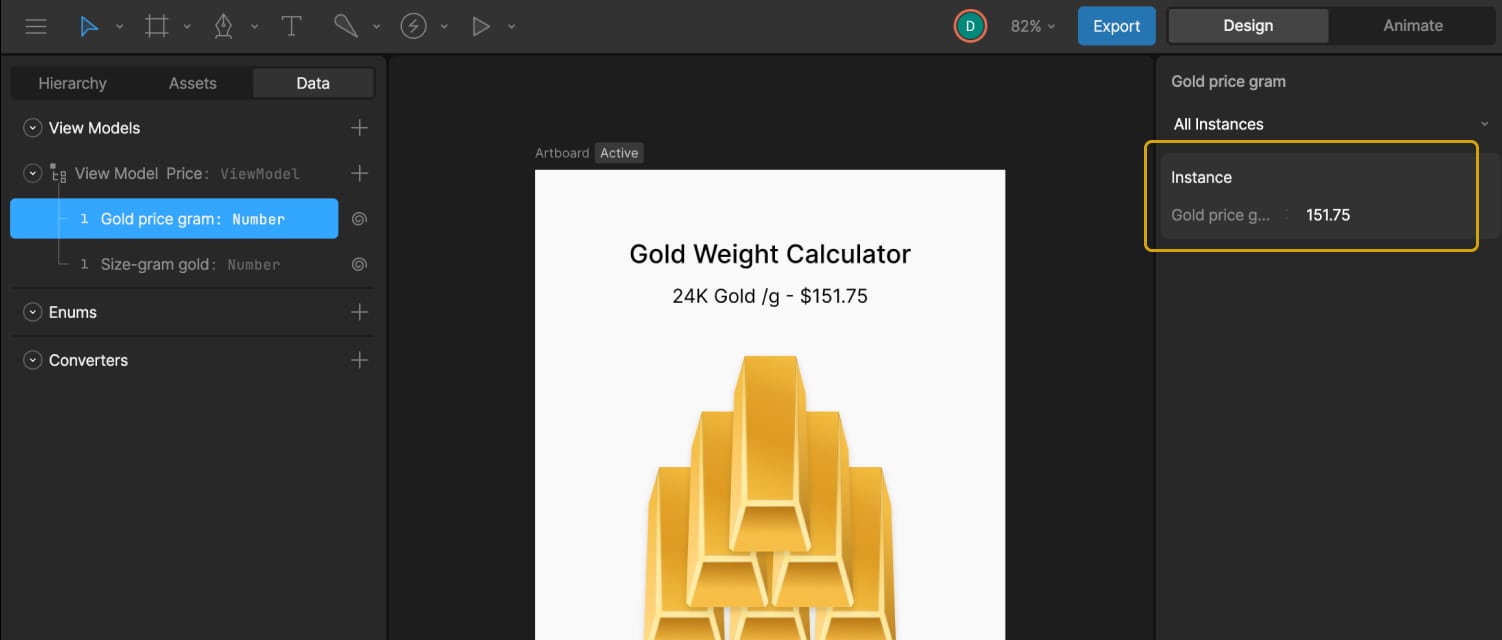
    To display this in the UI, we bound Text Run 2 in the title layout to this variable. A converter in the Strings tab called “Convert to String Price” is then created and applied to that text run. This converter formats the number correctly for display and will be reused later.

    4.2 Gold Bar Size Control

    We already had a number variable called Size-gram gold, which controls the weight of the gold bar used in the nested artboard illustration.

    In the Listeners panel, two listeners are created. The first is set to target the 5g tab, uses a Pointer Down action, and assigns Size-gram gold = 0. The second targets the 10g tab, also with a Pointer Down action, and assigns Size-gram gold = 1.

    Next, two timelines (one for each tab state) are brought into the state machine. The 10g timeline is used as the default state, with transitions added: one from 10g to 5g when Size-gram gold = 0, and one back to 10g when Size-gram gold = 1. Each transition has a duration of 100ms to keep the switching smooth.

    4.3 Gold Bar Quantity

    Next, added another number variable, Quantity-gold, to track the number of selected bars. The default value is set to 1. In the Converters under Numeric, two “Calculate” converters are created — one that adds “+1” and one that subtracts “-1”.

    In the Listeners panel, the plus button is assigned an action: Quantity-gold = Quantity-gold, using the “+1” converter. This way, clicking the plus button increases the count by 1. The same is done for the minus button, assigning Quantity-gold = Quantity-gold and attaching the “-1” converter. Clicking the minus button decreases the count by 1.

    Inside the state machine, six timelines are connected to represent bar counts from 1 to 6. Each transition uses the Quantity-gold value to trigger the correct timeline.

    By default, the plus button would keep increasing the value endlessly, but the goal is to limit the max to six bars. On the timeline where six gold bars are active, the plus button is disabled by setting its click area scale to 0 and lowering its opacity to create a “disabled” visual state. On all other timelines, those properties are returned to their active values.

    The same logic is applied to the minus button to prevent values lower than one. On the timeline with one bar, the button is disabled, and on all others, it returns to its active state.

    Almost there!

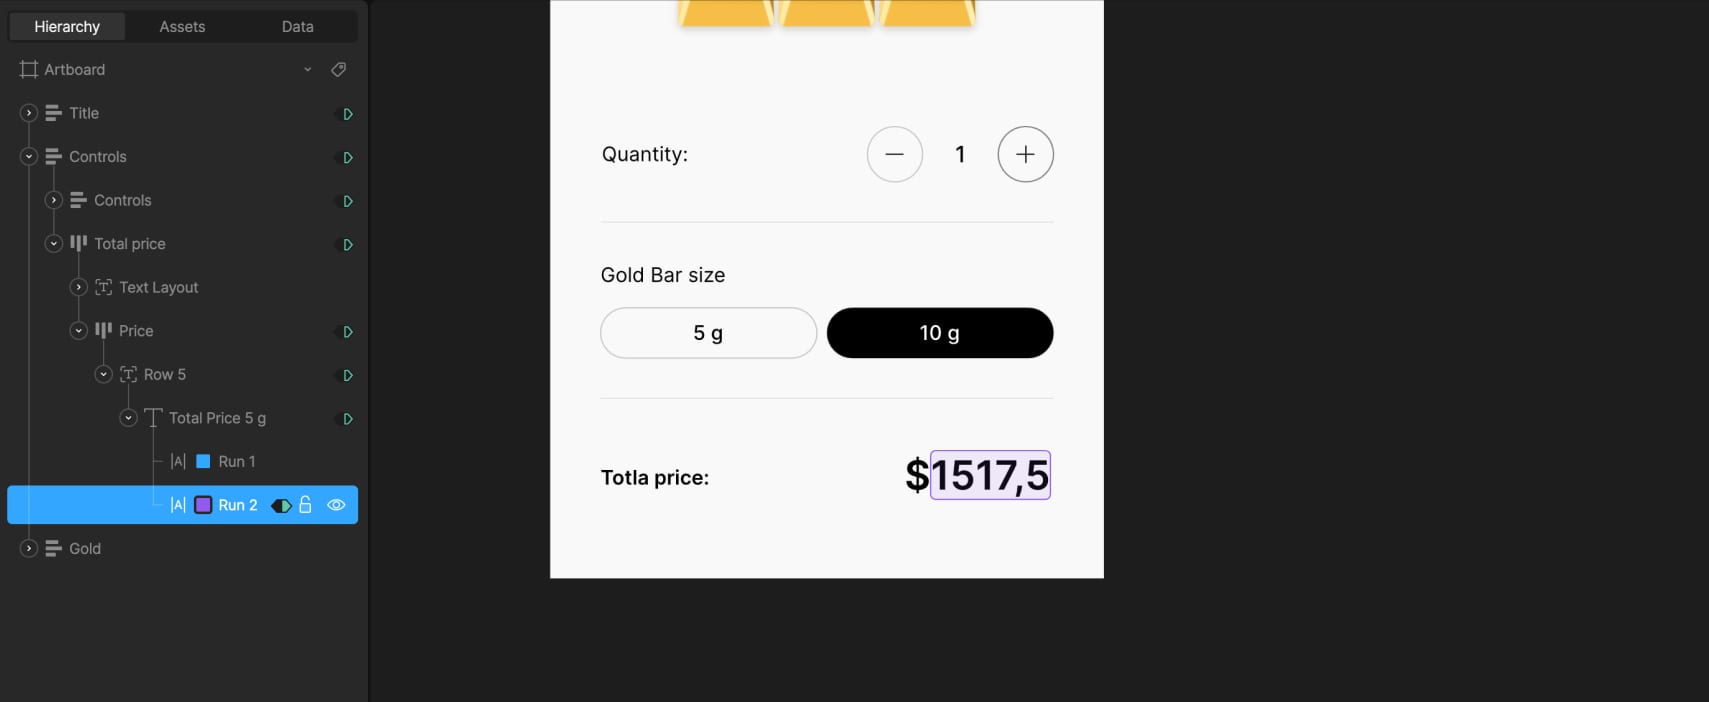
    4.4 Total Price Logic

    For the 5g bar price, we calculated it using this formula:

    Total Price = Gold price gram + Quantity-gold * 5

    In Converters → Numeric, a Formula converter was created and named Total Price 5g Formula to calculate the total price. In the example, it looked like:

    {{View Model Price/Gold price gram}}*{{View Model Price/Quanity-gold}}*5.0

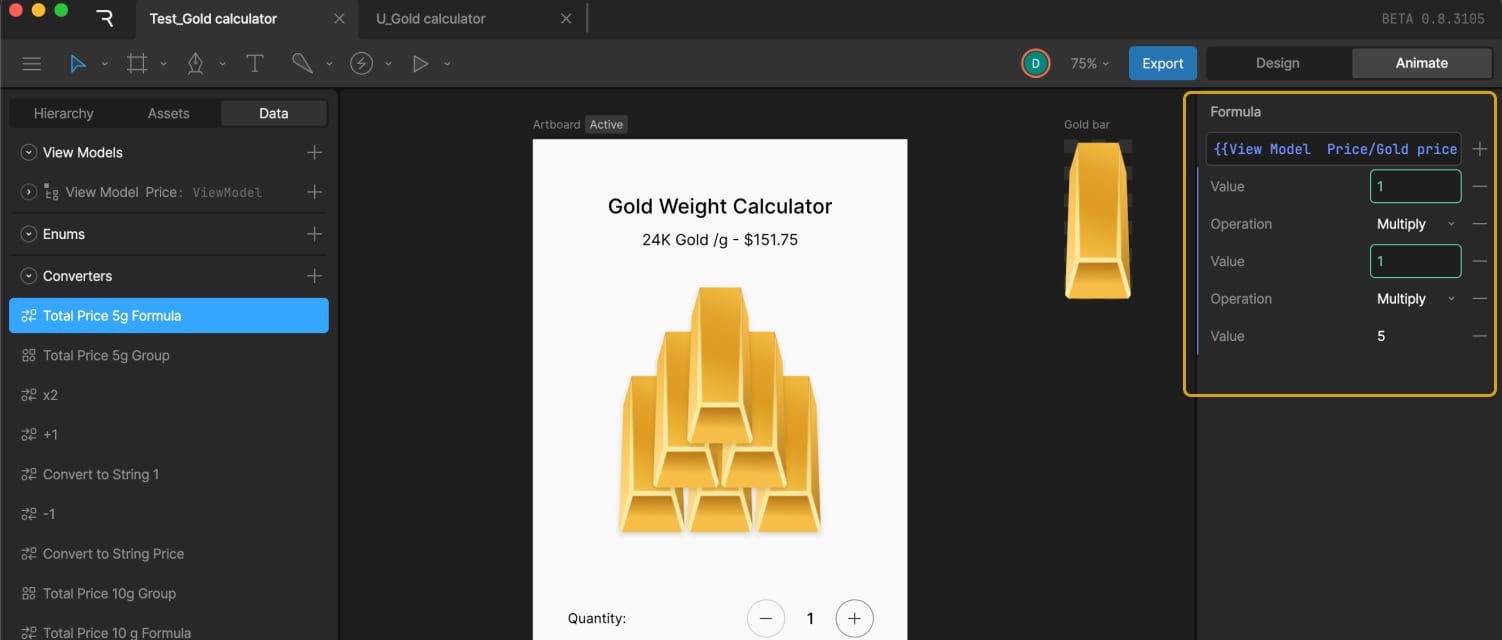
    Since we needed to display this number as text, the Total Price number variable was also converted into a string. For that, we used an existing converter called “Convert to String Price.”

    To use both converters together, a Group of converters was created and named Total Price 5g Group, which included the Total Price 5g Formula converter followed by the Convert to String Price converter.

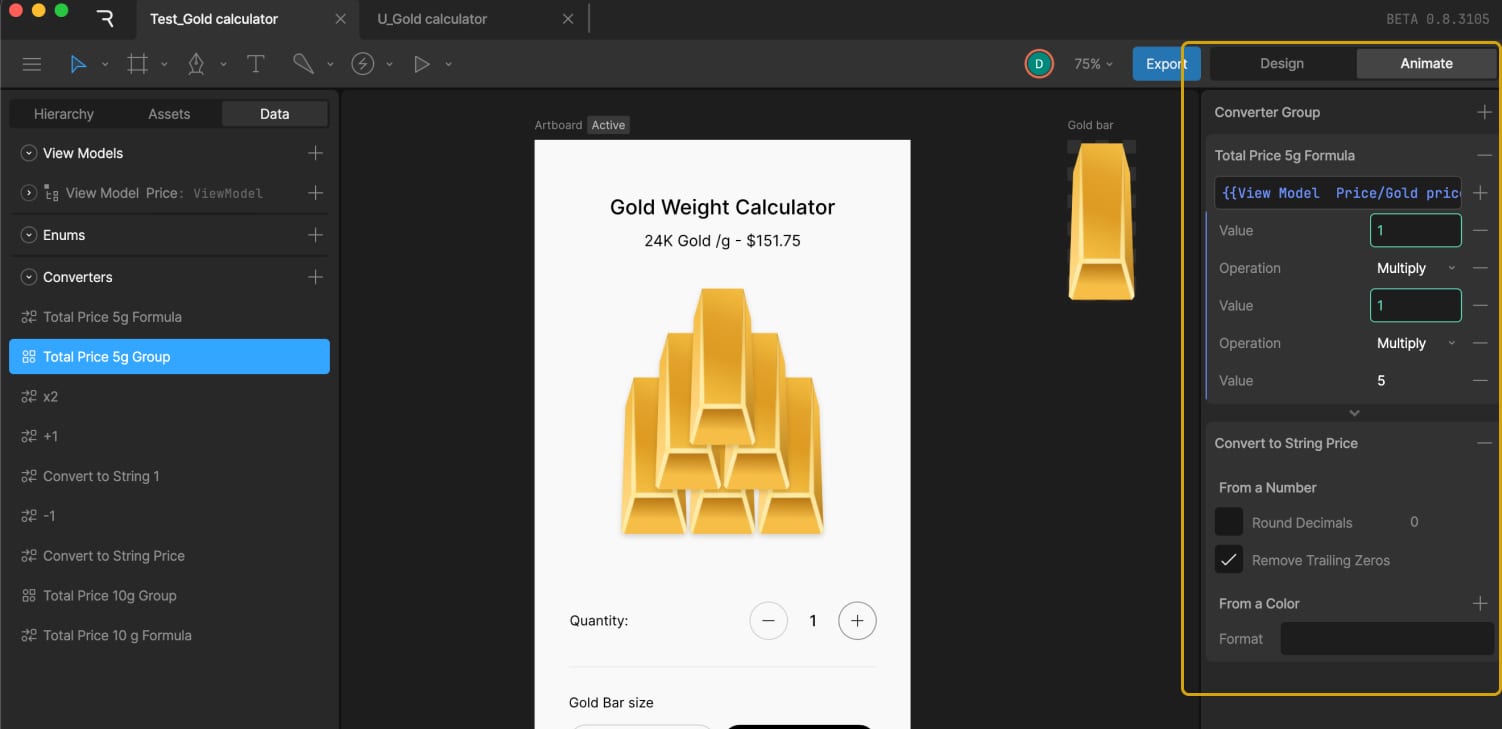
    Then, the text for the price variable was data bound by adding the Total Price variable in the Property field and selecting Total Price 5g Group in the Convert field.

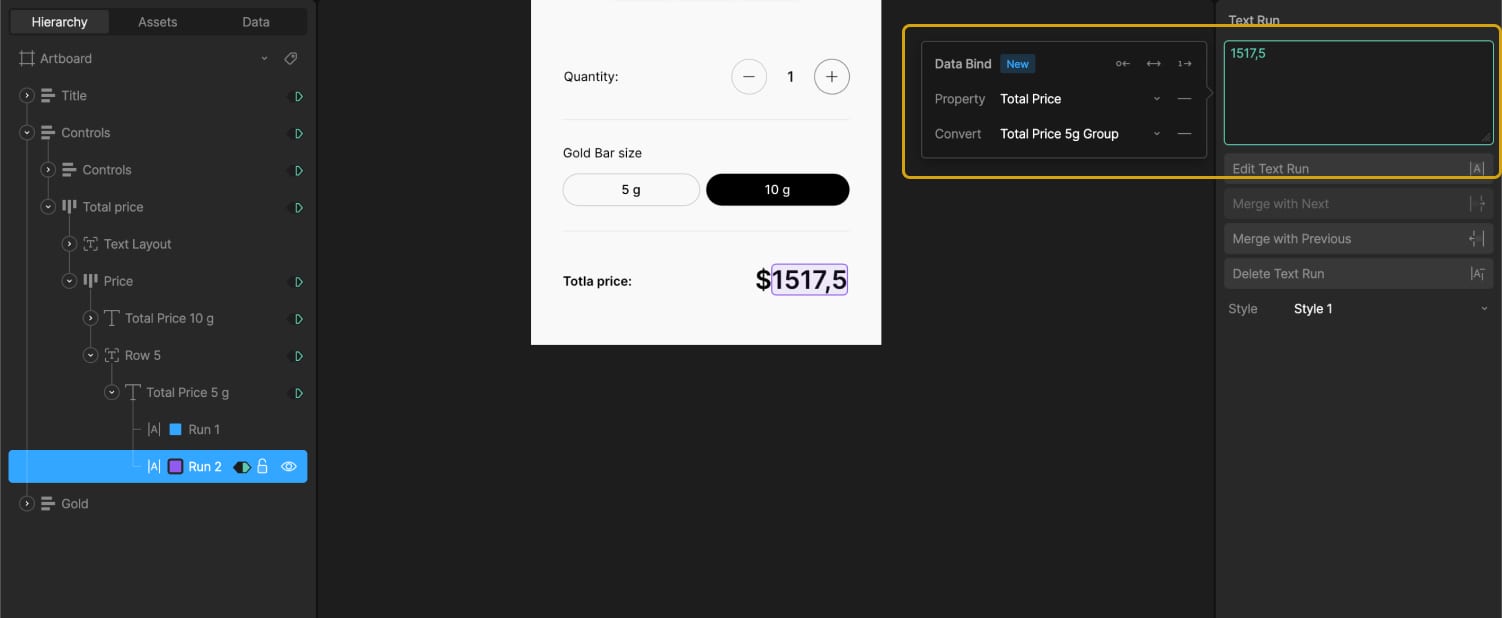
    To handle the 10g case, which is double the price, two options are explored — either creating a new converter that multiplies by 10 or multiplying the existing result by 2.

    Eventually, a second text element is added along with a new group of converters specifically for 10g. This includes a new formula:

    Total Price = Gold price gram + Quantity-gold * 10

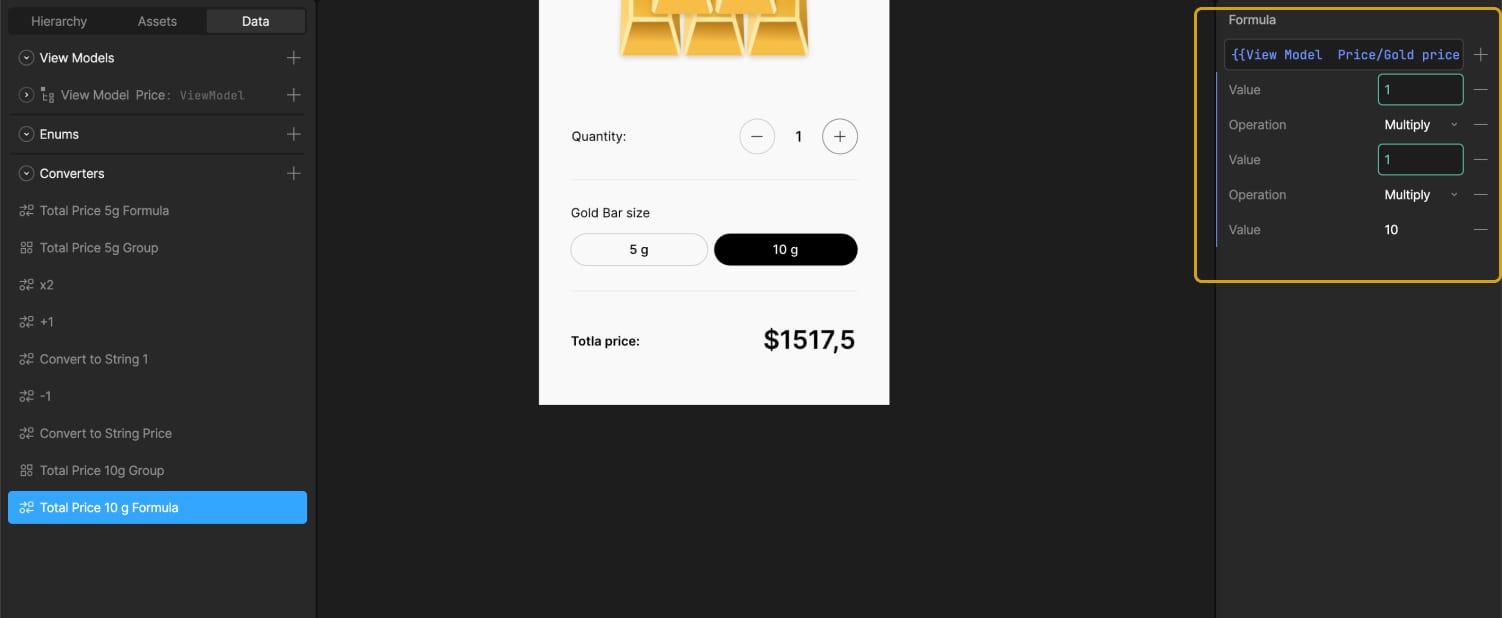
    A formula converter and a group with both that formula and the string converter are created and named “Total Price 10g Group.”

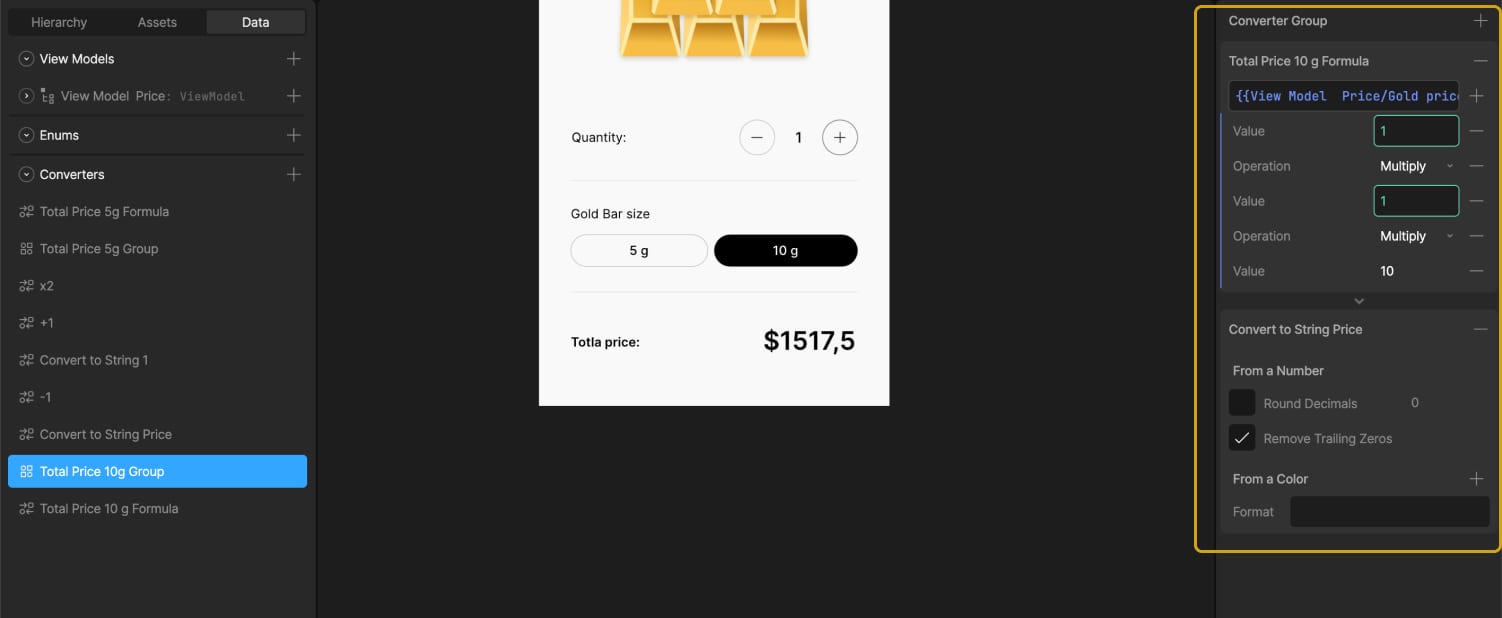
    Using timelines where the 5g and 10g buttons are in their active states, we adjusted the transparency of the text elements. This way, the total price connected to the 5g converters group is visible when the 5g button is selected, and the price from the 10g converters group appears when the 10g button is selected.

    It works perfectly.

    After this setup, the Gold price gram variable can be connected to live external data, allowing the gold price in the calculator to reflect the current market value in real time.

    Wrapping Up

    This gold calculator project is a simple example, but it shows how data binding in Rive can be used to connect visual design with real-time logic — without needing to jump between separate tools or write custom code. By combining state machines, variables, and converters, you can build interfaces that are not only animated but also smart and responsive.

    Whether you’re working on a product UI, a prototype, or a standalone interactive graphic, Rive gives you a way to bring together motion and behavior in a single space. If you’re already experimenting with Rive, data binding opens up a whole new layer of possibilities to explore.


    Source link

  • From Static to Dynamic: 3 Micro-Animations Every Web Developer Can Master with Rive

    From Static to Dynamic: 3 Micro-Animations Every Web Developer Can Master with Rive


    Interactive web animations have become essential for modern websites, but choosing the right implementation approach can be challenging. CSS, Video and JavaScript are the familiar methods and each certainly has its place in a developer’s toolkit. When you need your site to have unique custom interactions (while remaining light and performant, of course), that’s where Rive shines.

    Rive animations, whether vector or raster, look crisp at any size, are lightweight (often smaller than equivalent Lottie files), and can respond to user interactions and real-time data through a straightforward JavaScript API.

    This tutorial will walk you through Rive’s workflow and implementation process using three practical examples. We’ll build them step-by-step using a fictional smart plant care company called “TapRoot” as our case study, so you can see exactly how Rive fits into a real development process and decide if it’s right for your next project.

    There are countless ways to use Rive, but we’ll focus on these three patterns:

    1. Animated Hero Images create an immediate emotional connection and brand personality
    2. Interactive CTAs increase conversion rates by providing clear, satisfying feedback
    3. Flexible Layouts combine elements into an experience that works at any size

    Each pattern builds on the previous one, teaching you progressively more sophisticated Rive techniques while solving real-world UX challenges.

    Pattern 1: The Living Hero Image

    The Static Starting Point

    A static hero section for TapRoot could feature a photo of their smart plant pot with overlay text. It show’s the product, but we can do better.

    Creating the Rive Animation

    Let’s create an animated version that transforms this simple scene into a revealing experience that literally shows what makes TapRoot “smarter than it looks.” The animation features:

    • Gently swaying leaves: Constant, subtle motion brings a sense of life to the page.
    • Interior-reveal effect: Hovering over the pot reveals the hidden root system and embedded sensors
    • Product Feature Callouts: Key features are highlighted with interactive callouts

    Although Rive is vector-based, you can also import JPG, PNG, and PSD files. With an embedded image, a mesh can be constructed and a series of bones can be bound to it. Animating the bones gives the subtle motion of the leaves moving. We’ll loop it at a slow speed so the motion is noticeable, but not distracting.

    Adding Interactivity

    Next we’ll add a hover animation that reveals the inside of the pot. By clipping the image of the front of the pot to a rectangle, we can resize the shape to reveal the layers underneath. Using a joystick allows us to have an animation follow the cursor when it’s in within the hit area of the pot and snap back to normal when the cursor leaves the area.

    Feature Callouts

    With a nested artboard, it is easy to build a single layout to create multiple versions of an element. In this case, a feature callout has an updated icon, title, and short description for three separate features.

    The Result

    What was once a simple product photo is now an interactive revelation of TapRoot’s hidden intelligence. The animation embodies the brand message—”smarter than it looks”—by literally revealing the sophisticated technology beneath a beautifully minimal exterior.

    Pattern 2: The Conversion-Boosting Interactive CTA

    Beyond the Basic Button

    Most CTAs are afterthoughts—a colored rectangle with text. But your CTA is often the most important element on your page. Let’s make it irresistible.

    The Static Starting Point

    <button class="cta-button">Get yours today</button>
    .cta-button {
      background: #4CAF50;
      color: white;
      padding: 16px 32px;
      border: none;
      border-radius: 8px;
      font-size: 18px;
      cursor: pointer;
      transition: background-color 0.3s;
    }
    
    .cta-button:hover {
      background: #45a049;
    }

    Looks like this:

    Get’s the job done, but we can do better.

    The Rive Animation Design

    Our smart CTA tells a story in three states:

    1. Idle State: Clean, minimal button with an occasional “shine” animation
    2. Hover State: Fingerprint icon begins to follow the cursor
    3. Click State: An animated “tap” of the button

    Pattern 3: Flexible Layout

    Next we can combine the elements into a responsive animated layout that works on any device size. Rive’s layout features familiar row and column arrangements and lets you determine how your animated elements fit within areas as they resize.

    Check this out on the Rive Marketplace to dive into the file or remix it: https://rive.app/community/files/21264-39951-taproot-layout/

    Beyond These Three Patterns

    Once you’re comfortable with hero images, interactive CTAs, and flexible layouts, you can apply the same Rive principles to:

    • Loading states that tell stories while users wait
    • Form validation that guides users with gentle visual feedback
    • Data visualizations that reveal insights through motion
    • Onboarding flows that teach through interaction
    • Error states that maintain user confidence through friendly animation

    Your Next Steps

    1. Start Simple: Choose one existing static element on your site
    2. Design with Purpose: Every animation should solve a real user problem
    3. Test and Iterate: Measure performance and user satisfaction
    4. Explore Further: Check out the Rive Documentation and Community for inspiration

    Conclusion

    The web is becoming more interactive and alive. By understanding how to implement Rive animations—from X-ray reveals to root network interactions—you’re adding tools that create experiences users remember and share.

    The difference between a good website and a great one often comes down to these subtle details: the satisfying feedback of a button click, the smooth transition between themes, the curiosity sparked by hidden technology. These micro-interactions connect with users on an emotional level while providing genuine functional value.


    Source link

  • Motion Highlights: Rive Special | Codrops

    Motion Highlights: Rive Special | Codrops


    The

    New

    Collective

    🎨✨💻 Stay ahead of the curve with handpicked, high-quality frontend development and design news, picked freshly every single day. No fluff, no filler—just the most relevant insights, inspiring reads, and updates to keep you in the know.

    Prefer a weekly digest in your inbox? No problem, we got you covered. Just subscribe here.


    Source link

  • Integrating Rive into a React Project: Behind the Scenes of Valley Adventures

    Integrating Rive into a React Project: Behind the Scenes of Valley Adventures


    Bringing new tools into a workflow is always exciting—curiosity bumps up against the comfort of familiar methods. But when our longtime client, Chumbi Valley, came to us with their Valley Adventures project, we saw the perfect opportunity to experiment with Rive and craft cartoon-style animations that matched the playful spirit of the brand.

    Rive is a powerful real-time interactive design tool with built-in support for interactivity through State Machines. In this guide, we’ll walk you through how we integrated a .riv file into a React environment and added mouse-responsive animations.

    We’ll also walk through a modernized integration method using Rive’s newer Data Binding feature—our current preferred approach for achieving the same animation with less complexity and greater flexibility.

    Animation Concept & File Preparation

    Valley Adventures is a gamified Chumbi NFT staking program, where magical creatures called Chumbi inhabit an enchanted world. The visual direction leans heavily into fairytale book illustrations—vibrant colors, playful characters, and a whimsical, cartoon-like aesthetic.

    To immediately immerse users in this world, we went with a full-section hero animation on the landing page. We split the animation into two parts:

    • an idle animation that brings the scene to life;
    • a cursor-triggered parallax effect, adding depth and interactivity.

    Several elements animate simultaneously—background layers like rustling leaves and flickering fireflies, along with foreground characters that react to movement. The result is a dynamic, storybook-like experience that invites users to explore.

    The most interesting—and trickiest—part of the integration was tying animations to mouse tracking. Rive provides a built-in way to handle this: by applying constraints with varying strengths to elements within a group that’s linked to Mouse Tracking, which itself responds to the cursor’s position.

    However, we encountered a limitation with this approach: the HTML buttons layered above the Rive asset were blocking the hover state, preventing it from triggering the animation beneath.

    To work around this, we used a more robust method that gave us finer control and avoided those problems altogether. 

    Here’s how we approached it:

    1. Create four separate timelines, each with a single keyframe representing an extreme position of the animation group:
      • Far left
      • Far right
      • Top
      • Bottom
    2. Add two animation layers, each responsible for blending between opposite keyframes:
      • Layer 1 blends the far-left and far-right timelines
      • Layer 2 blends the top and bottom timelines
    3. Tie each layer’s blend amount to a numeric input—one for the X axis, one for the Y axis.

    By adjusting the values of these inputs based on the cursor’s position, you can control how tightly the animation responds on each axis. This approach gives you a smoother, more customizable parallax effect—and prevents unexpected behavior caused by overlapping UI.

    Once the animation is ready, simply export it as a .riv file—and leave the rest of the magic to the devs.

    How We Did It: Integrating a Rive File into a React Project

    Before we dive further, let’s clarify what a .riv file actually is.

    A .riv file is the export format from the Rive editor. It can include:

    • vector graphics,
    • timeline animations,
    • a State Machine with input parameters.

    In our case, we’re using a State Machine with two numeric inputs: Axis_X and Axis_Y. These inputs are tied to how we control animation in Rive, using values from the X and Y axes of the cursor’s position.

    These inputs drive the movement of different elements—like the swaying leaves, fluttering fireflies, and even subtle character reactions—creating a smooth, interactive experience that responds to the user’s mouse.

    Step-by-Step Integration

    Step 1: Install the Rive React runtime

    Install the official package:

    npm install @rive-app/react-canvas

    Step 2: Create an Animation Component

    Create a component called RiveBackground.tsx to handle loading and rendering the animation.

    Step 3: Connect animation

    const { rive, setCanvasRef, setContainerRef } = useRive({
      src: 'https://cdn.rive.app/animations/hero.riv',
      autoplay: true,
      layout: new Layout({ fit: Fit.Cover, alignment: Alignment.Center }),
      onLoad: () => setIsLoaded(true),
      enableRiveAssetCDN: true,
    });
    

    For a better understanding, let’s take a closer look at each prop you’ll typically use when working with Rive in React:

    What each option does:

    Property Description
    src Path to your .riv file — can be local or hosted via CDN
    autoplay Automatically starts the animation once it’s loaded
    layout Controls how the animation fits into the canvas (we’re using Cover and Center)
    onLoad Callback that fires when the animation is ready — useful for setting isLoaded
    enableRiveAssetCDN Allows loading of external assets (like fonts or textures) from Rive’s CDN

    Step 4: Connect State Machine Inputs

    const numX = useStateMachineInput(rive, 'State Machine 1', 'Axis_X', 0);
    const numY = useStateMachineInput(rive, 'State Machine 1', 'Axis_Y', 0);

    This setup connects directly to the input values defined inside the State Machine, allowing us to update them dynamically in response to user interaction.

    • State Machine 1 — the name of your State Machine, exactly as defined in the Rive editor
    • Axis_X and Axis_Y — numeric inputs that control movement based on cursor position
    • 0 — the initial (default) value for each input

    ☝️ Important: Make sure your .riv file includes the exact names: Axis_X, Axis_Y, and State Machine 1. These must match what’s defined in the Rive editor — otherwise, the animation won’t respond as expected.

    Step 5: Handle Mouse Movement

    useEffect(() => {
      if (!numX || !numY) return;
    
      const handleMouseMove = (e: MouseEvent) => {
        const { innerWidth, innerHeight } = window;
        numX.value = (e.clientX / innerWidth) * 100;
        numY.value = 100 - (e.clientY / innerHeight) * 100;
      };
    
      window.addEventListener('mousemove', handleMouseMove);
      return () => window.removeEventListener('mousemove', handleMouseMove);
    }, [numX, numY]);

    What’s happening here:

    • We use clientX and clientY to track the mouse position within the browser window.
    • The values are normalized to a 0–100 range, matching what the animation expects.
    • These normalized values are then passed to the Axis_X and Axis_Y inputs in the Rive State Machine, driving the interactive animation.

    ⚠️ Important: Always remember to remove the event listener when the component unmounts to avoid memory leaks and unwanted behavior. 

    Step 6: Cleanup and Render the Component

    useEffect(() => {
      return () => rive?.cleanup();
    }, [rive]);

    And the render:

    return (
      <div
        ref={setContainerRef}
        className={`rive-container ${className ?? ''} ${isLoaded ? 'show' : 'hide'}`}
      >
        <canvas ref={setCanvasRef} />
      </div>
    );
    • cleanup() — frees up resources when the component unmounts. Always call this to prevent memory leaks.
    • setCanvasRef and setContainerRef — these must be connected to the correct DOM elements in order for Rive to render the animation properly.

    And here’s the complete code:

    import {
      useRive,
      useStateMachineInput,
      Layout,
      Fit,
      Alignment,
    } from '@rive-app/react-canvas';
    import { useEffect, useState } from 'react';
    
    export function RiveBackground({ className }: { className?: string }) {
      const [isLoaded, setIsLoaded] = useState(false);
    
      const { rive, setCanvasRef, setContainerRef } = useRive({
        src: 'https://cdn.rive.app/animations/hero.riv',
        animations: ['State Machine 1','Timeline 1','Timeline 2'
    ],
        autoplay: true,
        layout: new Layout({ fit: Fit.Cover, alignment: Alignment.Center }),
        onLoad: () => setIsLoaded(true),
        enableRiveAssetCDN: true,
      });
    
      const numX = useStateMachineInput(rive, 'State Machine 1', 'Axis_X', 0);
      const numY = useStateMachineInput(rive, 'State Machine 1', 'Axis_Y', 0);
    
      useEffect(() => {
        if (!numX || !numY) return;
    
        const handleMouseMove = (e: MouseEvent) => {
    	if (!numX || !numY) {
            return;
          }
    
          const { innerWidth, innerHeight } = window;
          numX.value = (e.clientX / innerWidth) * 100;
          numY.value = 100 - (e.clientY / innerHeight) * 100;
        };
    
        window.addEventListener('mousemove', handleMouseMove);
        return () => window.removeEventListener('mousemove', handleMouseMove);
      }, [numX, numY]);
    
      useEffect(() => {
        return () => {
          rive?.cleanup();
        };
      }, [rive]);
    
      return (
        <div
          ref={setContainerRef}
          className={`rive-container ${className ?? ''} ${isLoaded ? 'show' : 'hide'}`}
        >
          <canvas ref={setCanvasRef} />
        </div>
      );
    }
    

    Step 7: Use the Component

    Now you can use the RiveBackground like any other component:

    <RiveBackground className="hero-background" />

    Step 8: Preload the WASM File

    To avoid loading the .wasm file at runtime—which can delay the initial render—you can preload it in App.tsx:

    import riveWASMResource from '@rive-app/canvas/rive.wasm';
    
    <link
      rel="preload"
      href={riveWASMResource}
      as="fetch"
      crossOrigin="anonymous"
    />

    This is especially useful if you’re optimizing for first paint or overall performance.

    Simple Parallax: A New Approach with Data Binding

    In the first part of this article, we used a classic approach with a State Machine to create the parallax animation in Rive. We built four separate animations (top, bottom, left, right), controlled them using input variables, and blended their states to create smooth motion. This method made sense at the time, especially before Data Binding support was introduced.

    But now that Data Binding is available in Rive, achieving the same effect is much simpler—just a few steps. Data binding in Rive is a system that connects editor elements to dynamic data and code via view models, enabling reactive, runtime-driven updates and interactions between design and development.

    In this section, we’ll show how to refactor the original Rive file and code using the new approach.

    Updating the Rive File

    1. Remove the old setup:
      • Go to the State Machine.
      • Delete the input variables: top, bottom, left, right.
      • Remove the blending states and their associated animations.
    2. Group the parallax layers:
      • Wrap all the parallax layers into a new group—e.g., ParallaxGroup.
    3. Create binding parameters:
      • Select ParallaxGroup and add:
        • pointerX (Number)
        • pointerY (Number)
    4. Bind coordinates:
      • In the properties panel, set:
        • X → pointerX
        • Y → pointerY

    Now the group will move dynamically based on values passed from JavaScript.

    The Updated JS Code

    Before we dive into the updated JavaScript, let’s quickly define an important concept:

    When using Data Binding in Rive, viewModelInstance refers to the runtime object that links your Rive file’s bindable properties (like pointerX or pointerY) to your app’s logic. In the Rive editor, you assign these properties to elements like positions, scales, or rotations. At runtime, your code accesses and updates them through the viewModelInstance—allowing for real-time, declarative control without needing a State Machine.

    With that in mind, here’s how the new setup replaces the old input-driven logic:

    import { useRive } from '@rive-app/react-canvas';
    import { useEffect, useState } from 'react';
    
    export function ParallaxEffect({ className }: { className?: string }) {
      const [isLoaded, setIsLoaded] = useState(false);
    
      const { rive, setCanvasRef, setContainerRef } = useRive({
        src: 'https://cdn.rive.app/animations/hero.riv',
        autoplay: true,
        autoBind: true,
        onLoad: () => setIsLoaded(true),
      });
    
      useEffect(() => {
        if (!rive) return;
    
        const vmi = rive.viewModelInstance;
        const pointerX = vmi?.number('pointerX');
        const pointerY = vmi?.number('pointerY');
    
        if (!pointerX || !pointerY) return;
    
        const handleMouseMove = (e: MouseEvent) => {
          const { innerWidth, innerHeight } = window;
          const x = (e.clientX / innerWidth) * 100;
          const y = 100 - (e.clientY / innerHeight) * 100;
          pointerX.value = x;
          pointerY.value = y;
        };
    
        window.addEventListener('mousemove', handleMouseMove);
    
        return () => {
          window.removeEventListener('mousemove', handleMouseMove);
          rive.cleanup();
        };
      }, [rive]);
    
      return (
        <div
          ref={setContainerRef}
          className={`rive-container ${className ?? ''} ${isLoaded ? 'show' : 'hide'}`}
        >
          <canvas ref={setCanvasRef} />
        </div>
      );
    }

    The Result

    You get the same parallax effect, but:

    • without input variables or blending;
    • without a State Machine;
    • with simple control via the ViewModel.

    Official Live Example from Rive

    👉 CodeSandbox: Data Binding Parallax

    Conclusion

    Data Binding is a major step forward for interactive Rive animations. Effects like parallax can now be set up faster, more reliably, and with cleaner logic. We strongly recommend this approach for new projects.

    Final Thoughts

    So why did we choose Rive over Lottie for this project?

    • Interactivity: With Lottie, achieving the same level of interactivity would’ve required building a custom logic layer from scratch. With Rive, we got that behavior baked into the file—plug and play.
    • Optimization: Rive gives you more control over each asset inside the .riv file, and the output tends to be lighter overall.

    Our biggest takeaway? Don’t be afraid to experiment with new tools—especially when they feel like the right fit for your project’s concept. Rive matched the playful, interactive vibe of Valley Adventures perfectly, and we’re excited to keep exploring what it can do.


    Source link