The Testing Pyramid focuses on Unit Tests; the Testing Diamond focuses on Integration Tests; and what about the Testing Vial?
Table of Contents
Just a second! 🫷
If you are here, it means that you are a software developer.
So, you know that storage, networking, and domain management have a cost .If you want to support this blog, please ensure that you have disabled the adblocker for this site.
I configured Google AdSense to show as few ADS as possible – I don’t want to bother you with lots of ads, but I still need to add some to pay for the resources for my site.Thank you for your understanding.
– Davide
Testing is crucial in any kind of application. It can also be important in applications that are meant to be thrown away: in fact, with a proper testing strategy, you can ensure that the application will do exactly what you expect it to do; instead of running it over and over again to fix the parts, by adding some specific tests, you will speed up the development of that throwaway project.
The most common testing strategies are the Testing Pyramid and the Testing Diamond. They are both useful, but I think that they are not perfect.
That’s why I came up with a new testing strategy that I called “the Testing Vial”: in this article, I’m going to introduce it and explain the general idea.
Since it’s a new idea, I’d like to hear your honest feedback. Don’t be afraid to tell me that this is a terrible idea – let’s work on it together!
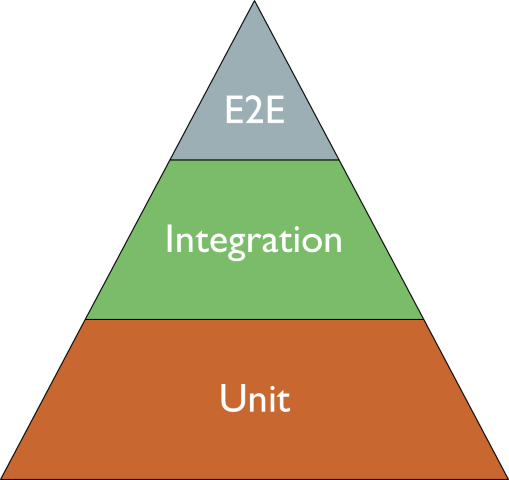
The Testing Pyramid: the focus is on Unit Tests
The Testing Pyramid is a testing strategy where the focus is on Unit Tests.
Unit Tests are easy to write (well, they are often easy to write: it depends on whether your codebase is a mess!), they are fast to execute, so they provide immediate feedback.
So, the focus here is on technical details: if you create a class named Foo, most probably you will have its sibling class FooTests. And the same goes for each (public) method in it.
Yes, I know: unit tests can operate across several methods of the same class, as long as it is considered a “unit”. But let’s be real: most of the time, we write tests against each single public method. And, even worse, we are overusing mocks.
Problems with the Testing Pyramid
The Testing Pyramid relies too much on unit tests.
But Unit Tests are not perfect:
- They often rely too much on mocks: tests might not reflect the real execution of the system;
- They are too closely coupled with the related class and method: if you add one parameter to one single method, you most probably will have to update tens of test methods;
- They do not reflect the business operations: you might end up creating the strongest code ever, but missing the point of the whole business meaning. Maybe, because you focused too much on technical details and forgot to evaluate all the acceptance criteria.
Now, suppose that you have to change something big, like
- add OpenTelemetry support on the whole system;
- replace SQL with MongoDB;
- refactor a component, replacing a huge internal switch-case block with the Chain Of Responsibility pattern.
Well, in this case, you will have to update or delete a lot of Unit Tests. And, still, you might not be sure you haven’t added regressions. This is one of the consequences of focusing too much on Unit Tests.
The Testing Diamond: the focus is on Integration Tests
The Testing Diamond emphasises the importance of Integration Tests.
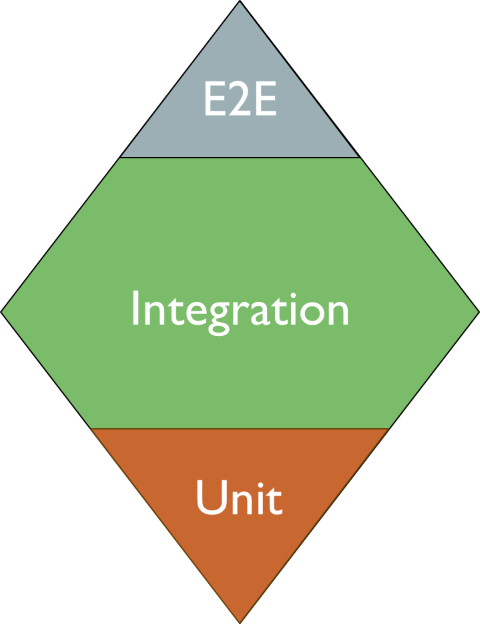
So, when using this testing strategy, you are expected to write many more Integration Tests and way fewer Unit Tests.
In my opinion, this is a better approach to testing: this way, you can focus more on the business value and less on the technical details.
Using this approach, you may refactor huge parts of the system without worrying too much about regressions and huge changes in tests: in fact, Integration Tests will give you a sort of safety net, ensuring that the system still works as expected.
So, if I had to choose, I’d go with the Testing Diamond: implementations may change, while the overall application functionality will still be preserved.
Problems with the Testing Diamond
Depending on the size of the application and on how it is structured, Integration Tests may be time-consuming and hard to spin up.
Maybe you have a gigantic monolith that takes minutes to start up: in this case, running Integration Tests may take literally hours.
Also, there is a problem with data: if you are going to write data to a database (or an external resource), how can you ensure that the operation does not insert duplicate or dirty data?
For this problem, there are several solutions, such as:
- using Ephemeral Environments specifically to run these tests;
- using TestContainers to create a sandbox environment;
- replacing some specific operations (like saving data on the DB or sending HTTP requests) by using a separate, standalone service (as we learned in this article, where we customised a WebApplicationFactory).
Those approaches may not be easy to implement, I know.
Also, Integration Tests alone may not cover all the edge cases, making your application less robust.
Introducing the Testing Vial: the focus is on business entities
Did you notice? Both the Testing Pyramid and the Testing Diamond focus on the technical aspects of the tests, and not on the meaning for the business.
I think that is a wrong approach, and that we should really shift our focus from the number of tests of a specific type (more Unit Tests or more Integration Tests?) to the organisational value they bring: that’s why I came up with the idea of the Testing Vial.
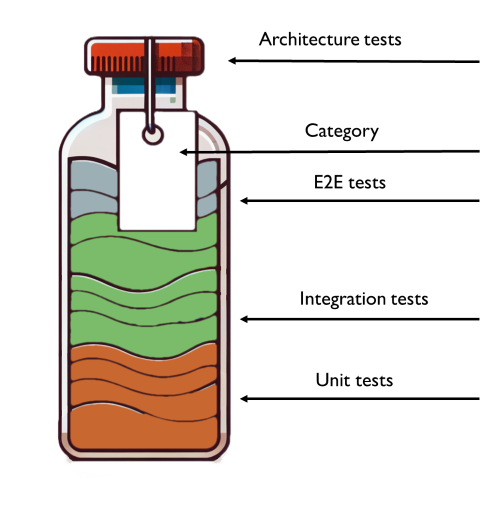
You can imagine tests to be organised into sealed vials.
In each vial, you have
- E2E tests: to at least cover the most critical flows
- Integration tests: to cover at least all the business requirements as they are described in the Acceptance Criteria of your User Stories (or, in general, to cover all Happy Paths and the most common Unhappy Paths);
- Unit test: to cover at least all the edge cases that are hard to reproduce with Integration tests.
So, using the Testing Vial, you don’t have to worry about the number of tests of a specific type: you only care that, regardless of their number, tests are focused on Business concerns.
But, ok, nothing fancy: it’s just common sense.
To make the Testing Vial effective, there are two more parts to add.
Architectural tests, to validate that the system design hasn’t changed
After you have all these tests, in a variable number which depends solely on what is actually helpful for you, you also write some Architectural Tests, for example by using ArchUnit, for Java, or ArchUnit.NET for .NET applications.
This way, other than focusing on the business value (regardless of this goal being achieved by Unit Tests or Integration Tests), you also validate that the system hasn’t changed in unexpected ways. For example, you might have added a dependency between modules, making the system more coupled and less maintainable.
Generally speaking, Architectural Tests should be written in the initial phases of a project, so that, by running them from time to time, they can ensure that nothing has changed.
With Architectural Tests, which act as a cap for the vial, you ensure that the tests are complete, valid, and that the architecture-wise maintainability of the system is preserved.
But that’s not enough!
Categories, to identify and isolate areas of your application
All of this makes sense if you add one or more tags to your tests: these tags should identify the business entity the test is referring to. For example, in an e-shop application, you should add categories about “Product”, “Cart”, “User”, and so on. This is way easier if you already do DDD, clearly.
In C# you can categorise tests by using TestCategory if you use MSTest or NUnit, or Trait if you use xUnit.*
[TestCategory("Cart")]
[TestCategory("User")]
public async Task User_Should_DoSomethingWithCart(){}
Ok, but why?
Well, categorising tests allows you to keep track of the impacts of a change more broadly. Especially at the beginning, you might notice that too many tests are marked with too many categories: this might be a sign of a poor design, and you might want to work to improve it.
Also, by grouping by category, you can have a complete view of everything that happens in the system about that specific Entity, regardless of the type of test.
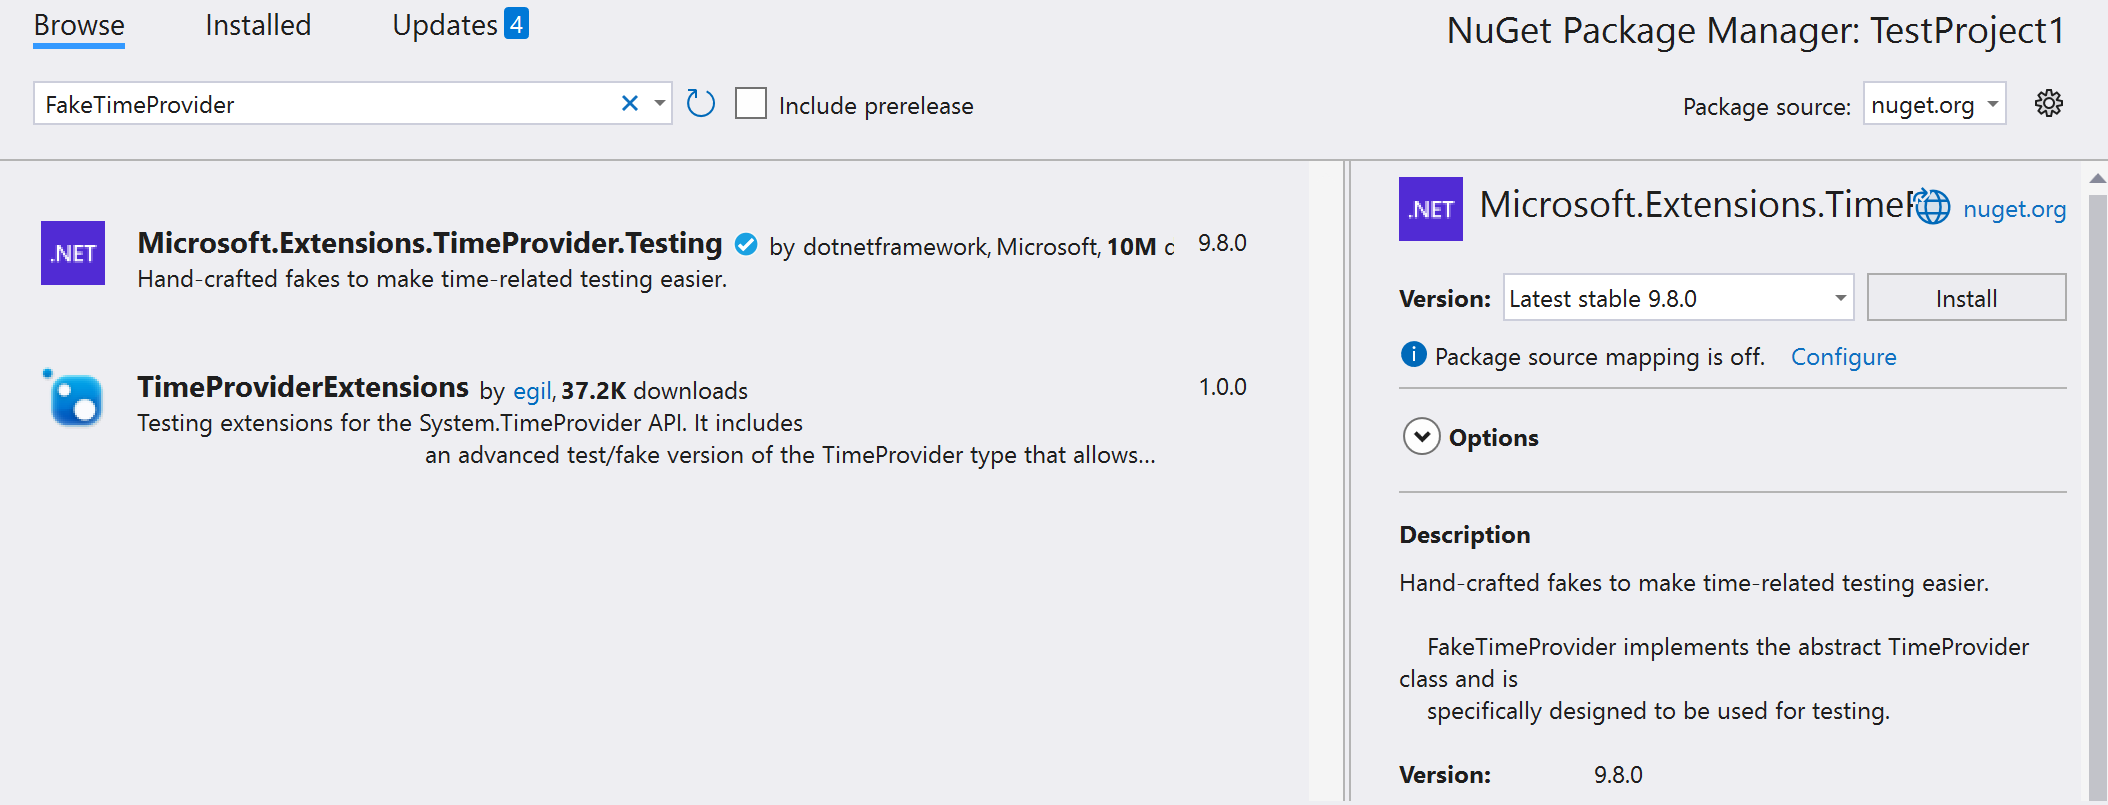
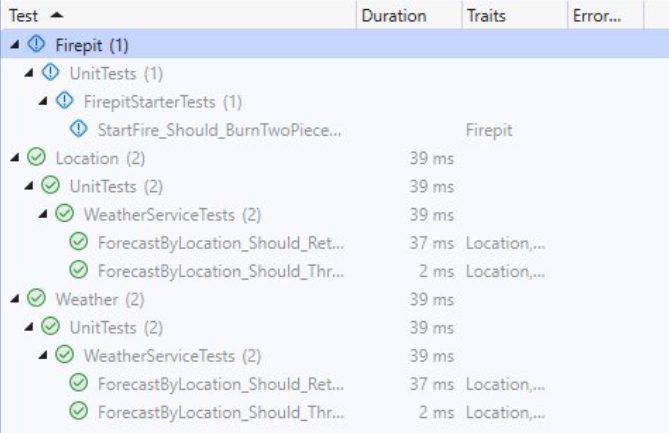
Did you know that in Visual Studio you can group tests by Category (called Traits), so that you can see and execute all the tests related to a specific Category?
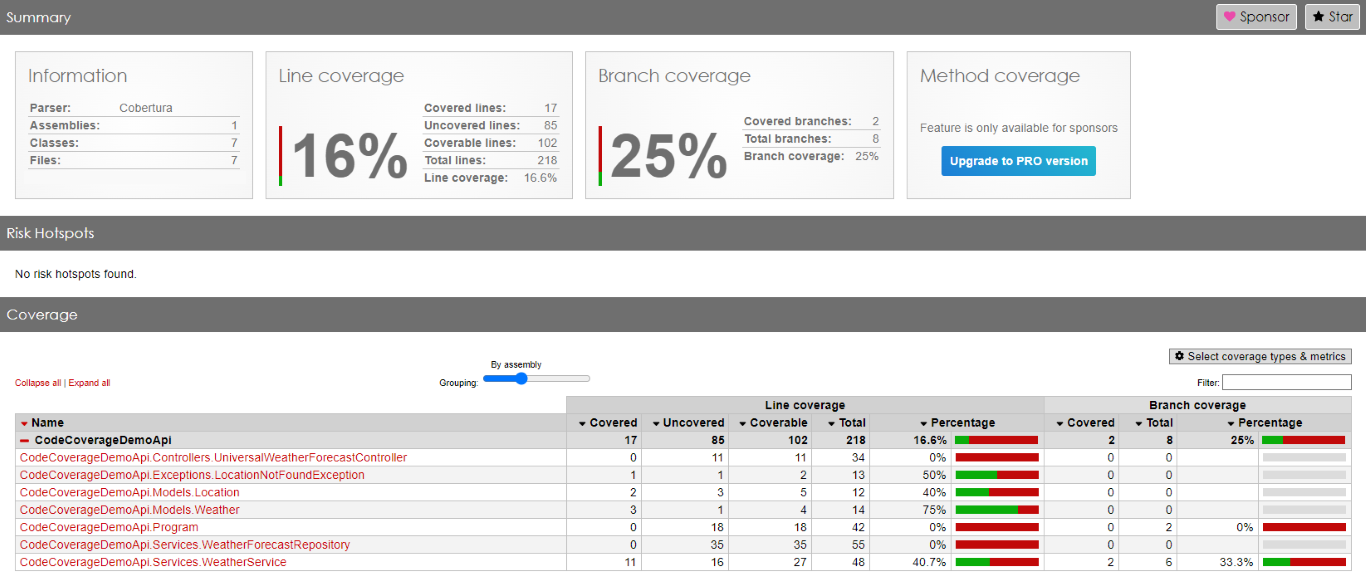
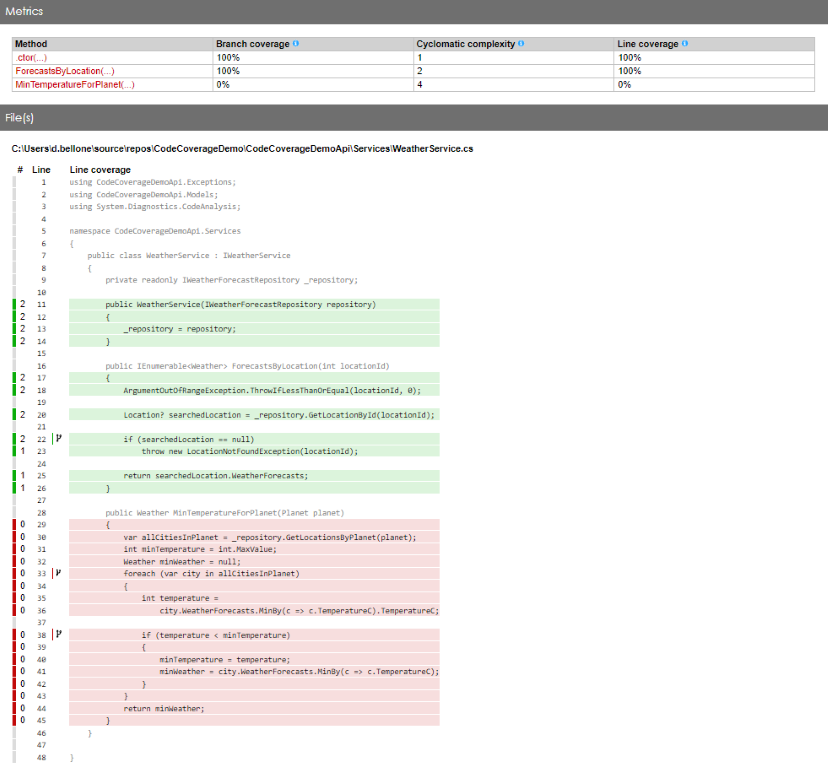
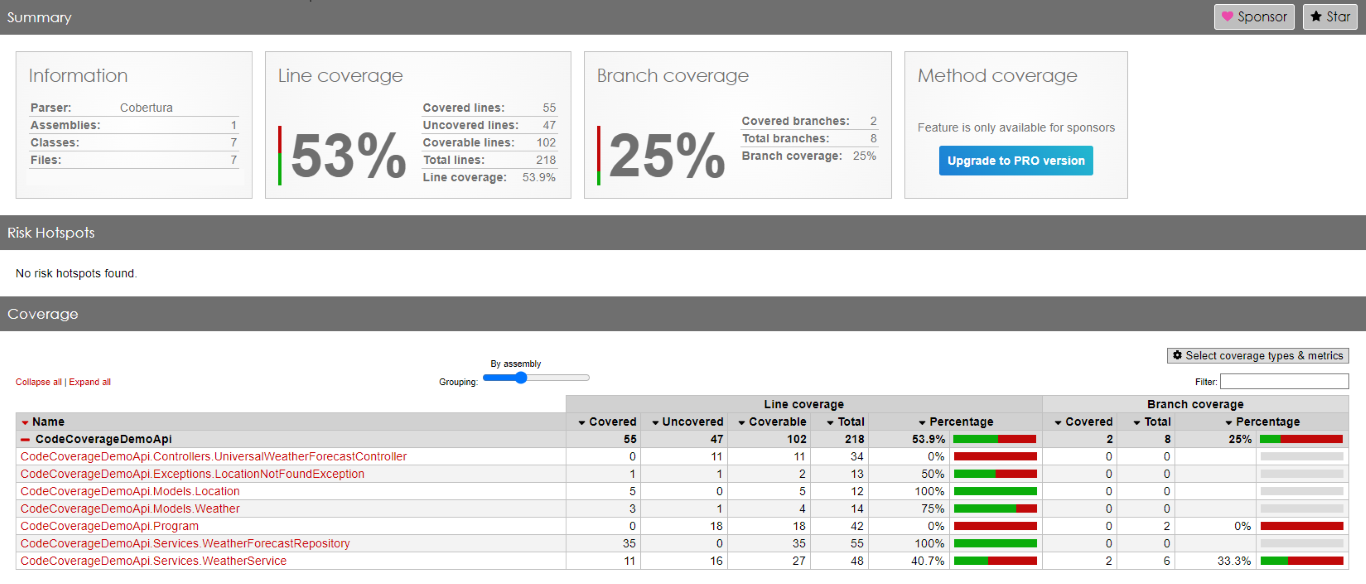
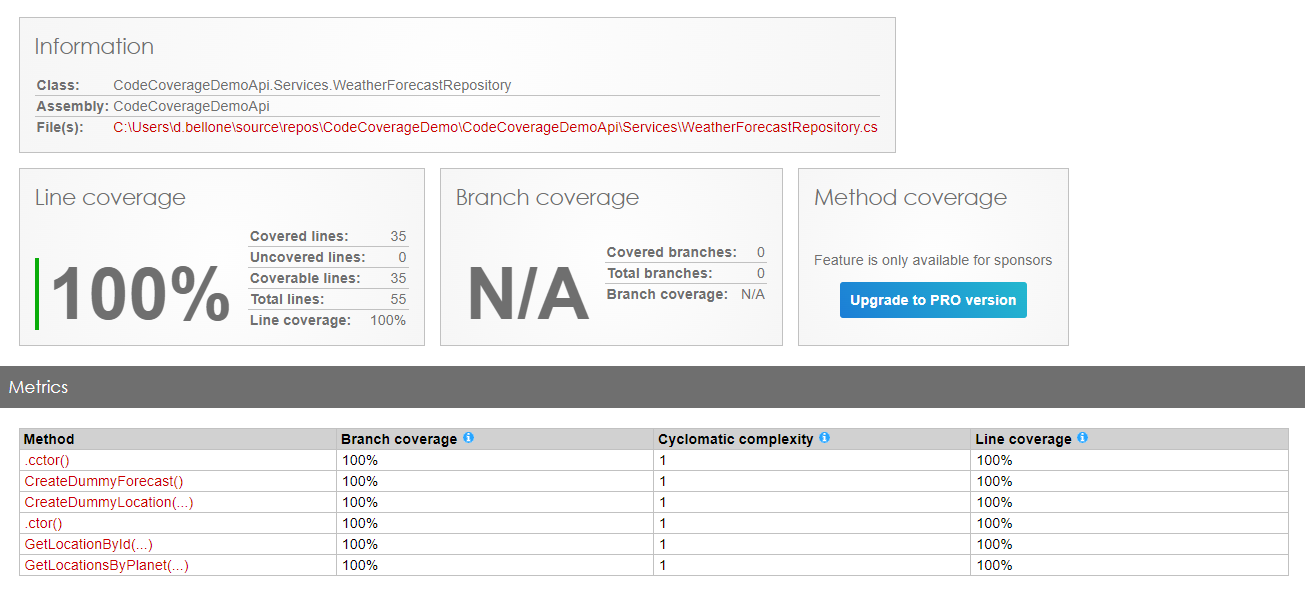
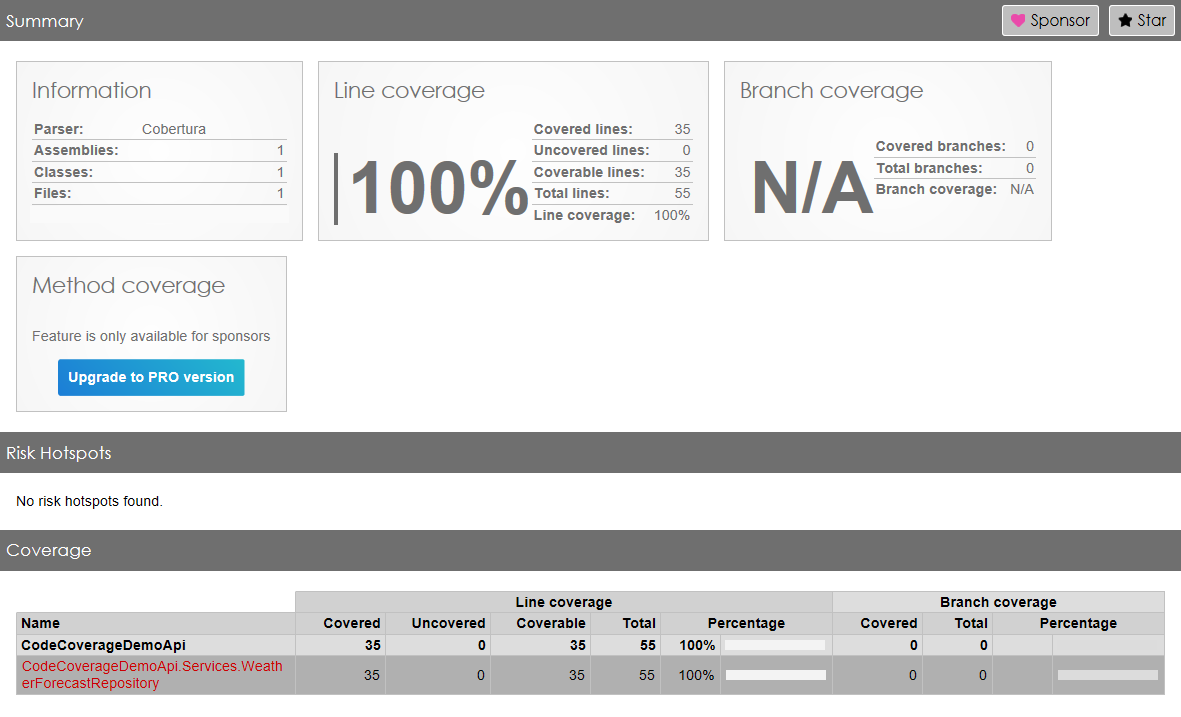
By using Code Coverage tools wisely – executing them in combination with tests of a specific category – you can identify all the parts of the application that are affected by such tests. This is especially true if you have many Integration Tests: just by looking at the executed methods, you can have a glimpse of all the parts touched by that test. This simple trick can also help you out with reorganising the application (maybe by moving from monolith to modular monolith).
Finally, having tests tagged, allows you to have a catalogue of all the Entities and their dependencies. And, in case you need to work on a specific activity that changes something about an Entity, you can perform better analyses to find potential, overlooked impacts.
Further readings
There is a lot of content about tests and testing strategies, so here are some of them.
End-to-End Testing vs Integration Testing | Testim
This article first appeared on Code4IT 🐧
In this article I described how I prefer the Testing Diamond over the Testing Pyramid.
Testing Pyramid vs Testing Diamond (and how they affect Code Coverage) | Code4IT
Then, I clearly changed my mind and came up with the idea of the Testing Vial.
Wrapping up
With the Testing Vial approach, the shift moves from technical to business concerns: you don’t really care if you’ve written more Unit Tests or more Integration tests; you only care that you have covered everything that the business requires, and that by using Architecture Tests and Test Categories you can make sure that you are not introducing unwanted dependencies between modules, improving maintainability.
Vials are meant to be standalone: by accessing the content of a vial, you can see everything related to it: its dependencies, its architecture, main user cases and edge cases.

Clearly, the same test may appear in multiple vials, but that’s not a problem.
I came up with this idea recently, so I want to hear from you what you think about it. I’m sure there are areas of improvement!
Let me know!
I hope you enjoyed this article! Let’s keep in touch on LinkedIn, Twitter or BlueSky! 🤜🤛
Happy coding!
🐧