Learn how to integrate Oh My Posh, a cross-platform tool that lets you create beautiful and informative prompts for PowerShell.
Table of Contents
Just a second! 🫷
If you are here, it means that you are a software developer.
So, you know that storage, networking, and domain management have a cost .If you want to support this blog, please ensure that you have disabled the adblocker for this site.
I configured Google AdSense to show as few ADS as possible – I don’t want to bother you with lots of ads, but I still need to add some to pay for the resources for my site.Thank you for your understanding.
– Davide
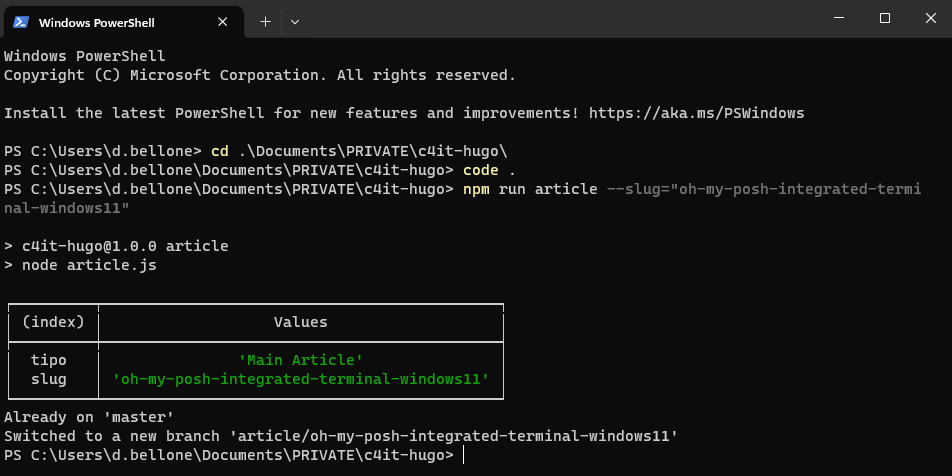
The content of the blog you are reading right now is stored in a Git repository. Every time I create an article, I create a new Git Branch to isolate the changes.
To generate the skeleton of the articles, I use the command line (well, I generally use PowerShell); in particular, given that I’m using both Windows 10 and Windows 11 – depending on the laptop I’m working on – I use the Integrated Terminal, which allows you to define the style, the fonts, and so on of every terminal configured in the settings.
The default profile is pretty basic: no info is shown except for the current path – I want to customize the appearance.
I want to show the status of the Git repository, including:
- repository name
- branch name
- outgoing commits
There are lots of articles that teach how to use OhMyPosh with Cascadia Code. Unfortunately, I couldn’t make them work.
In this article, I teach you how I fixed it on my local machine. It’s a step-by-step guide I wrote while installing it on my local machine. I hope it works for you as well!
Step 1: Create the $PROFILE file if it does not exist
In PowerShell, you can customize the current execution by updating the $PROFILE file.
Clearly, you first have to check if the profile file exists.
Open the PowerShell and type:
$PROFILE # You can also use $profile lowercase - it's the same!
This command shows you the expected path of this file. The file, if it exists, is stored in that location.

In this case, the $Profile file should be available under the folder C:\Users\d.bellone\Documents\WindowsPowerShell. In my case, it does not exist, though!
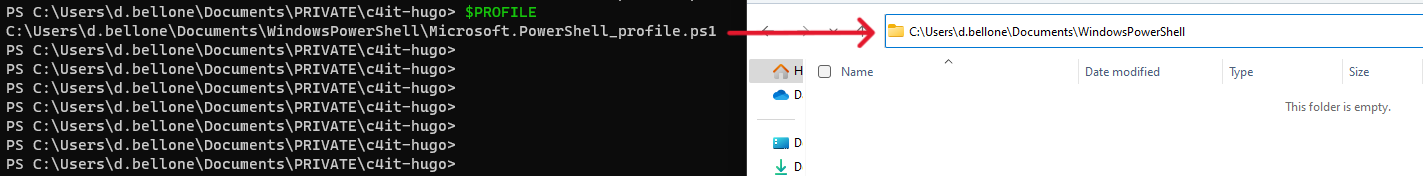
Therefore, you must create it manually: head to that folder and create a file named Microsoft.PowerShell_profile.ps1.
Note: it might happen that not even the WindowsPowerShell folder exists. If it’s missing, well, create it!
Step 2: Install OhMyPosh using Winget, Scoop, or PowerShell
To use OhMyPosh, we have to – of course – install it.
As explained in the official documentation, we have three ways to install OhMyPosh, depending on the tool you prefer.
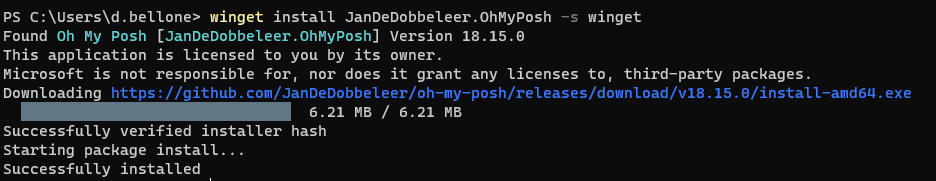
If you use Winget, just run:
winget install JanDeDobbeleer.OhMyPosh -s winget
If you prefer Scoop, the command is:
scoop install https://github.com/JanDeDobbeleer/oh-my-posh/releases/latest/download/oh-my-posh.json
And, if you like working with PowerShell, execute:
Set-ExecutionPolicy Bypass -Scope Process -Force; Invoke-Expression ((New-Object System.Net.WebClient).DownloadString('https://ohmyposh.dev/install.ps1'))
I used Winget, and you can see the installation process here:
Now, to apply these changes, you have to restart the PowerShell.
Step 3: Add OhMyPosh to the PowerShell profile
Open the Microsoft.PowerShell_profile.ps1 file and add the following line:
oh-my-posh init pwsh | Invoke-Expression
This command is executed every time you open the PowerShell with the default profile, and it initializes OhMyPosh to have it available during the current session.
Now, you can save and close the file.
Hint: you can open the profile file with Notepad by running notepad $PROFILE.
Step 4: Set the Execution Policy to RemoteSigned
Restart the terminal. In all probability, you will see an error like this:
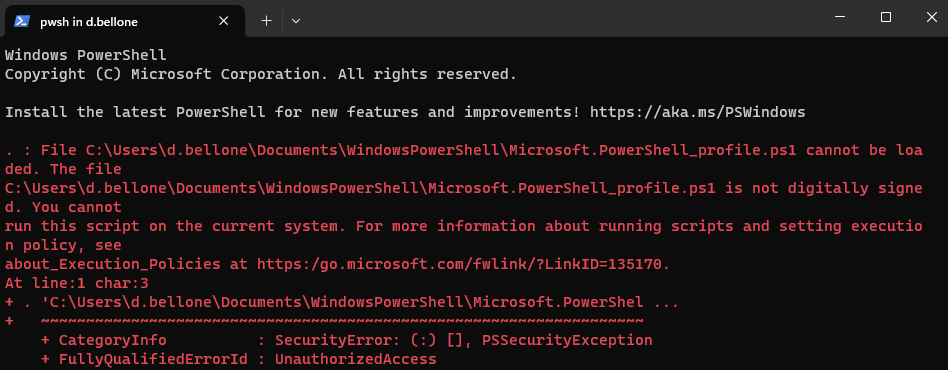
The error message
The file
<path>\Microsoft.PowerShell_profile.ps1is
not digitally signed. You cannot run this script on the current system
means that PowerShell does not trust the script it’s trying to load.
To see which Execution Policy is currently active, run:
You’ll probably see that the value is AllSigned.
To enable the execution of scripts created on your local machine, you have to set the Execution Policy value to RemoteSigned, using this command by running the PowerShell in administrator mode:
Set-ExecutionPolicy RemoteSigned
Let’s see the definition of the RemoteSigned Execution policy as per SQLShack’s article:
This is also a safe PowerShell Execution policy to set in an enterprise environment. This policy dictates that any script that was not created on the system that the script is running on, should be signed. Therefore, this will allow you to write your own script and execute it.
So, yeah, feel free to proceed and set the new Execution policy to have your PowerShell profile loaded correctly every time you open a new PowerShell instance.
Now, OhMyPosh can run in the current profile.
Head to a Git repository and notice that… It’s not working!🤬 Or, well, we have the Git information, but we are missing some icons and glyphs.
![]()
Step 5: Use CaskaydiaCove, not Cascadia Code, as a font
We still have to install the correct font with the missing icons.
We will install it using Chocolatey, a package manager available for Windows 11.
To check if you have it installed, run:
Now, to install the correct font family, open a PowerShell with administration privileges and run:
choco install cascadia-code-nerd-font
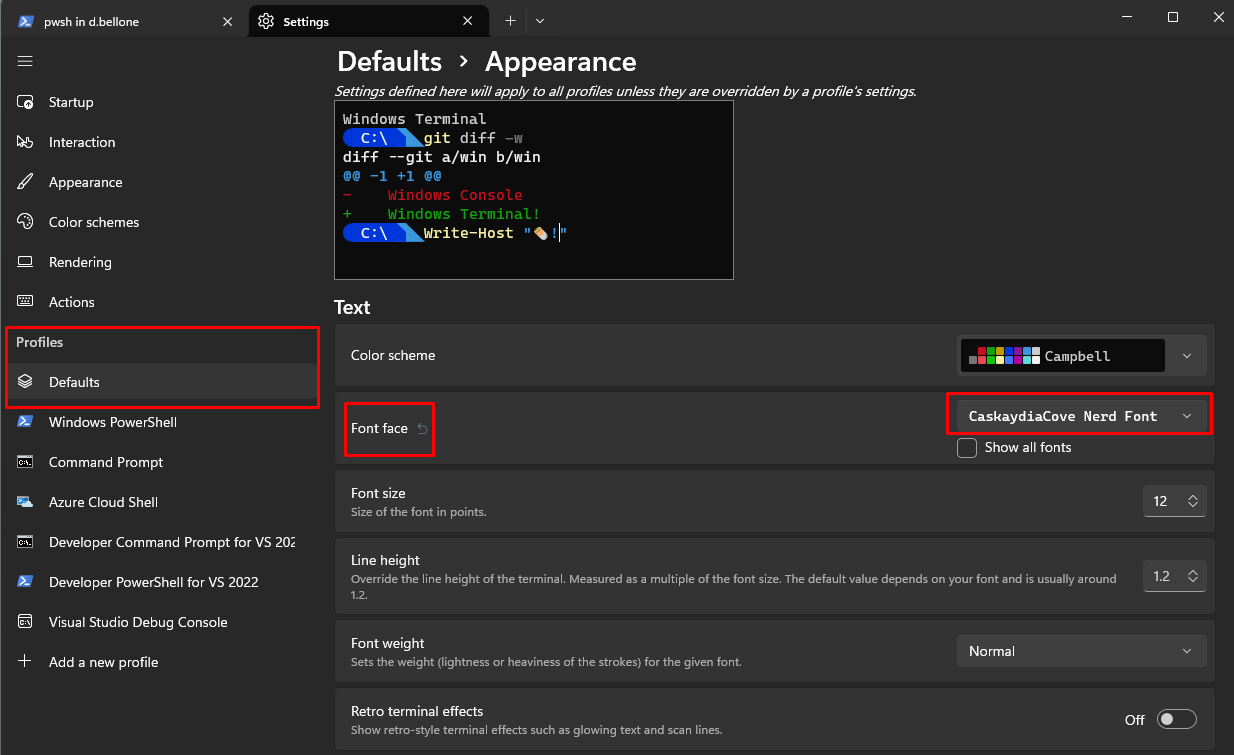
Once the installation is complete, you must tell Integrated Terminal to use the correct font by following these steps:
- open to the Settings page (by hitting
CTRL + ,) - select the profile you want to update (in my case, I’ll update the default profile)
- open the Appearance section
- under Font face select CaskaydiaCove Nerd Font
Now close the Integrated Terminal to apply the changes.
Open it again, navigate to a Git repository, and admire the result.

Further readings
The first time I read about OhMyPosh, it was on Scott Hanselman’s blog. I couldn’t make his solution work – and that’s the reason I wrote this article. However, in his article, he shows how he customized his own Terminal with more glyphs and icons, so you should give it a read.
🔗 My Ultimate PowerShell prompt with Oh My Posh and the Windows Terminal | Scott Hanselman’s blog
We customized our PowerShell profile with just one simple configuration. However, you can do a lot more. You can read Ruud’s in-depth article about PowerShell profiles.
🔗 How to Create a PowerShell Profile – Step-by-Step | Lazyadmin
One of the core parts of this article is that we have to use CaskaydiaCove as a font instead of the (in)famous Cascadia Code. But why?
🔗 Why CaskaydiaCove and not Cascadia Code? | GitHub
Finally, as I said at the beginning of this article, I use Git and Git Branches to handle the creation and management of my blog articles. That’s just the tip of the iceberg! 🏔️
If you want to steal my (previous) workflow, have a look at the behind-the-scenes of my blogging process (note: in the meanwhile, a lot of things have changed, but these steps can still be helpful for you)
This article first appeared on Code4IT 🐧
Wrapping up
In this article, we learned how to install OhMyPosh in PowerShell and overcome all the errors you (well, I) don’t see described in other articles.
I wrote this step-by-step article alongside installing these tools on my local machine, so I’m confident the solution will work.
Did this solution work for you? Let me know! 📨
I hope you enjoyed this article! Let’s keep in touch on Twitter or LinkedIn! 🤜🤛
Happy coding!
🐧