برچسب: Code

  • Clean code tips – Tests | Code4IT


    Tests are as important as production code. Well, they are even more important! So writing them well brings lots of benefits to your projects.

    Table of Contents

    Just a second! 🫷
    If you are here, it means that you are a software developer.
    So, you know that storage, networking, and domain management have a cost .

    If you want to support this blog, please ensure that you have disabled the adblocker for this site.
    I configured Google AdSense to show as few ADS as possible – I don’t want to bother you with lots of ads, but I still need to add some to pay for the resources for my site.

    Thank you for your understanding.
    Davide

    Clean code principles apply not only to production code but even to tests. Indeed, a test should be even more clean, easy-to-understand, and meaningful than production code.

    In fact, tests not only prevent bugs: they even document your application! New team members should look at tests to understand how a class, a function, or a module works.

    So, every test must have a clear meaning, must have its own raison d’être, and must be written well enough to let the readers understand it without too much fuss.

    In this last article of the Clean Code Series, we’re gonna see some tips to improve your tests.

    If you are interested in more tips about Clean Code, here are the other articles:

    1. names and function arguments
    2. comments and formatting
    3. abstraction and objects
    4. error handling
    5. tests

    Why you should keep tests clean

    As I said before, tests are also meant to document your code: given a specific input or state, they help you understand what the result will be in a deterministic way.

    But, since tests are dependent on the production code, you should adapt them when the production code changes: this means that tests must be clean and flexible enough to let you update them without big issues.

    If your test suite is a mess, even the slightest update in your code will force you to spend a lot of time updating your tests: that’s why you should organize your tests with the same care as your production code.

    Good tests have also a nice side effect: they make your code more flexible. Why? Well, if you have a good test coverage, and all your tests are meaningful, you will be more confident in applying changes and adding new functionalities. Otherwise, when you change your code, you will not be sure not only that the new code works as expected, but that you have not introduced any regression.

    So, having a clean, thorough test suite is crucial for the life of your application.

    How to keep tests clean

    We’ve seen why we should write clean tests. But how should you write them?

    Let’s write a bad test:

    [Test]
    public void CreateTableTest()
    {
        //Arrange
        string tableContent = @"<table>
            <thead>
                <tr>
                    <th>ColA</th>
                    <th>ColB</th>
                </tr>
            </thead>
            <tbody>
                <tr>
                    <td>Text1A</td>
                    <td>Text1B</td>
                </tr>
                <tr>
                    <td>Text2A</td>
                    <td>Text2B</td>
                </tr>
            </tbody>
        </table>";
    
        var tableInfo = new TableInfo(2);
    
    
        HtmlDocument doc = new HtmlDocument();
        doc.LoadHtml(tableContent);
        var node = doc.DocumentNode.ChildNodes[0];
    
        var part = new TableInfoCreator(node);
    
        var result = part.CreateTableInfo();
    
        tableInfo.SetHeaders(new string[] { "ColA", "ColB" });
        tableInfo.AddRow(new string[] { "Text1A", "Text1B" });
        tableInfo.AddRow(new string[] { "Text2A", "Text2B" });
    
        result.Should().BeEquivalentTo(tableInfo);
    }
    

    This test proves that the CreateTableInfo method of the TableInfoCreator class parses correctly the HTML passed in input and returns a TableInfo object that contains info about rows and headers.

    This is kind of a mess, isn’t it? Let’s improve it.

    Use appropriate test names

    What does CreateTableTest do? How does it help the reader understand what’s going on?

    We need to explicitly say what the tests want to achieve. There are many ways to do it; one of the most used is the Given-When-Then pattern: every method name should express those concepts, possibly in a consistent way.

    I like to use always the same format when naming tests: {Something}_Should_{DoSomething}_When_{Condition}. This format explicitly shows what and why the test exists.

    So, let’s change the name:

    [Test]
    public void CreateTableInfo_Should_CreateTableInfoWithCorrectHeadersAndRows_When_TableIsWellFormed()
    {
        //Arrange
        string tableContent = @"<table>
            <thead>
                <tr>
                    <th>ColA</th>
                    <th>ColB</th>
                </tr>
            </thead>
            <tbody>
                <tr>
                    <td>Text1A</td>
                    <td>Text1B</td>
                </tr>
                <tr>
                    <td>Text2A</td>
                    <td>Text2B</td>
                </tr>
            </tbody>
        </table>";
    
        var tableInfo = new TableInfo(2);
    
    
        HtmlDocument doc = new HtmlDocument();
        doc.LoadHtml(tableContent);
        HtmlNode node = doc.DocumentNode.ChildNodes[0];
    
        var part = new TableInfoCreator(node);
    
        var result = part.CreateTableInfo();
    
        tableInfo.SetHeaders(new string[] { "ColA", "ColB" });
        tableInfo.AddRow(new string[] { "Text1A", "Text1B" });
        tableInfo.AddRow(new string[] { "Text2A", "Text2B" });
    
        result.Should().BeEquivalentTo(tableInfo);
    }
    

    Now, just by reading the name of the test, we know what to expect.

    Initialization

    The next step is to refactor the tests to initialize all the stuff in a better way.

    The first step is to remove the creation of the HtmlNode seen in the previous example, and move it to an external function: this will reduce code duplication and help the reader understand the test without worrying about the HtmlNode creation details:

    [Test]
    public void CreateTableInfo_Should_CreateTableWithHeadersAndRows_When_TableIsWellFormed()
    {
        //Arrange
        string tableContent = @"<table>
            <thead>
                <tr>
                    <th>ColA</th>
                    <th>ColB</th>
                </tr>
            </thead>
            <tbody>
                <tr>
                    <td>Text1A</td>
                    <td>Text1B</td>
                </tr>
                <tr>
                    <td>Text2A</td>
                    <td>Text2B</td>
                </tr>
            </tbody>
        </table>";
    
        var tableInfo = new TableInfo(2);
    
     // HERE!
        HtmlNode node = CreateNodeElement(tableContent);
    
        var part = new TableInfoCreator(node);
    
        var result = part.CreateTableInfo();
    
        tableInfo.SetHeaders(new string[] { "ColA", "ColB" });
        tableInfo.AddRow(new string[] { "Text1A", "Text1B" });
        tableInfo.AddRow(new string[] { "Text2A", "Text2B" });
    
        result.Should().BeEquivalentTo(tableInfo);
    }
    
    
    private static HtmlNode CreateNodeElement(string content)
    {
        HtmlDocument doc = new HtmlDocument();
        doc.LoadHtml(content);
        return doc.DocumentNode.ChildNodes[0];
    }
    

    Then, depending on what you are testing, you could even extract input and output creation into different methods.

    If you extract them, you may end up with something like this:

    [Test]
    public void CreateTableInfo_Should_CreateTableWithHeadersAndRows_When_TableIsWellFormed()
    {
        var node = CreateWellFormedHtmlTable();
    
        var part = new TableInfoCreator(node);
    
        var result = part.CreateTableInfo();
    
        TableInfo tableInfo = CreateWellFormedTableInfo();
    
        result.Should().BeEquivalentTo(tableInfo);
    }
    
    private static TableInfo CreateWellFormedTableInfo()
    {
        var tableInfo = new TableInfo(2);
        tableInfo.SetHeaders(new string[] { "ColA", "ColB" });
        tableInfo.AddRow(new string[] { "Text1A", "Text1B" });
        tableInfo.AddRow(new string[] { "Text2A", "Text2B" });
        return tableInfo;
    }
    
    private HtmlNode CreateWellFormedHtmlTable()
    {
        var table = CreateWellFormedTable();
        return CreateNodeElement(table);
    }
    
    private static string CreateWellFormedTable()
        => @"<table>
            <thead>
                <tr>
                    <th>ColA</th>
                    <th>ColA</th>
                </tr>
            </thead>
            <tbody>
                <tr>
                    <td>Text1A</td>
                    <td>Text1B</td>
                </tr>
                <tr>
                    <td>Text2A</td>
                    <td>Text2B</td>
                </tr>
            </tbody>
        </table>";
    

    So, now, the general structure of the test is definitely better. But, to understand what’s going on, readers have to jump to the details of both CreateWellFormedHtmlTable and CreateWellFormedTableInfo.

    Even worse, you have to duplicate those methods for every test case. You could do a further step by joining the input and the output into a single object:

    
    public class TableTestInfo
    {
        public HtmlNode Html { get; set; }
        public TableInfo ExpectedTableInfo { get; set; }
    }
    
    private TableTestInfo CreateTestInfoForWellFormedTable() =>
    new TableTestInfo
    {
        Html = CreateWellFormedHtmlTable(),
        ExpectedTableInfo = CreateWellFormedTableInfo()
    };
    

    and then, in the test, you simplify everything in this way:

    [Test]
    public void CreateTableInfo_Should_CreateTableWithHeadersAndRows_When_TableIsWellFormed()
    {
        var testTableInfo = CreateTestInfoForWellFormedTable();
    
        var part = new TableInfoCreator(testTableInfo.Html);
    
        var result = part.CreateTableInfo();
    
        TableInfo tableInfo = testTableInfo.ExpectedTableInfo;
    
        result.Should().BeEquivalentTo(tableInfo);
    }
    

    In this way, you have all the info in a centralized place.

    But, sometimes, this is not the best way. Or, at least, in my opinion.

    In the previous example, the most important part is the elaboration of a specific input. So, to help readers, I usually prefer to keep inputs and outputs listed directly in the test method.

    On the contrary, if I had to test for some properties of a class or method (for instance, test that the sorting of an array with repeated values works as expected), I’d extract the initializations outside the test methods.

    AAA: Arrange, Act, Assert

    A good way to write tests is to write them with a structured and consistent template. The most used way is the Arrange-Act-Assert pattern:

    That means that in the first part of the test you set up the objects and variables that will be used; then, you’ll perform the operation under test; finally, you check if the test passes by using assertion (like a simple Assert.IsTrue(condition)).

    I prefer to explicitly write comments to separate the 3 parts of each test, like this:

    [Test]
    public void CreateTableInfo_Should_CreateTableWithHeadersAndRows_When_TableIsWellFormed()
    {
        // Arrange
        var testTableInfo = CreateTestInfoForWellFormedTable();
        TableInfo expectedTableInfo = testTableInfo.ExpectedTableInfo;
    
        var part = new TableInfoCreator(testTableInfo.Html);
    
        // Act
        var actualResult = part.CreateTableInfo();
    
        // Assert
        actualResult.Should().BeEquivalentTo(expectedTableInfo);
    }
    

    Only one assertion per test (with some exceptions)

    Ideally, you may want to write tests with only a single assertion.

    Let’s take as an example a method that builds a User object using the parameters in input:

    public class User
    {
        public string FirstName { get; set; }
        public string LastName { get; set; }
        public DateTime BirthDate { get; set; }
        public Address AddressInfo { get; set; }
    }
    
    public class Address
    {
        public string Country { get; set; }
        public string City { get; set; }
    }
    
    public User BuildUser(string name, string lastName, DateTime birthdate, string country, string city)
    {
        return new User
        {
            FirstName = name,
            LastName = lastName,
            BirthDate = birthdate,
            AddressInfo = new Address
            {
                Country = country,
                City = city
            }
        };
    }
    

    Nothing fancy, right?

    So, ideally, we should write tests with a single assert (ignore in the next examples the test names – I removed the when part!):

    [Test]
    public void BuildUser_Should_CreateUserWithCorrectName()
    {
        // Arrange
        var name = "Davide";
    
        // Act
        var user = BuildUser(name, null, DateTime.Now, null, null);
    
        // Assert
        user.FirstName.Should().Be(name);
    }
    
    [Test]
    public void BuildUser_Should_CreateUserWithCorrectLastName()
    {
        // Arrange
        var lastName = "Bellone";
    
        // Act
        var user = BuildUser(null, lastName, DateTime.Now, null, null);
    
        // Assert
        user.LastName.Should().Be(lastName);
    }
    

    … and so on. Imagine writing a test for each property: your test class will be full of small methods that only clutter the code.

    If you can group assertions in a logical way, you could write more asserts in a single test:

    [Test]
    public void BuildUser_Should_CreateUserWithCorrectPlainInfo()
    {
        // Arrange
        var name = "Davide";
        var lastName = "Bellone";
        var birthDay = new DateTime(1991, 1, 1);
    
        // Act
        var user = BuildUser(name, lastName, birthDay, null, null);
    
        // Assert
        user.FirstName.Should().Be(name);
        user.LastName.Should().Be(lastName);
        user.BirthDate.Should().Be(birthDay);
    }
    

    This is fine because the three properties (FirstName, LastName, and BirthDate) are logically on the same level and with the same meaning.

    One concept per test

    As we stated before, it’s not important to test only one property per test: each and every test must be focused on a single concept.

    By looking at the previous examples, you can notice that the AddressInfo property is built using the values passed as parameters on the BuildUser method. That makes it a good candidate for its own test.

    Another way of seeing this tip is thinking of the properties of an object (I mean, the mathematical properties). If you’re creating your custom sorting, think of which properties can be applied to your method. For instance:

    • an empty list, when sorted, is still an empty list
    • an item with 1 item, when sorted, still has one item
    • applying the sorting to an already sorted list does not change the order

    and so on.

    So you don’t want to test every possible input but focus on the properties of your method.

    In a similar way, think of a method that gives you the number of days between today and a certain date. In this case, just a single test is not enough.

    You have to test – at least – what happens if the other date:

    • is exactly today
    • it is in the future
    • it is in the past
    • it is next year
    • it is February, the 29th of a valid year (to check an odd case)
    • it is February, the 30th (to check an invalid date)

    Each of these tests is against a single value, so you might be tempted to put everything in a single test method. But here you are running tests against different concepts, so place every one of them in a separate test method.

    Of course, in this example, you must not rely on the native way to get the current date (in C#, DateTime.Now or DateTime.UtcNow). Rather, you have to mock the current date.

    FIRST tests: Fast, Independent, Repeatable, Self-validating, and Timed

    You’ll often read the word FIRST when talking about the properties of good tests. What does FIRST mean?

    It is simply an acronym. A test must be Fast, Independent, Repeatable, Self-validating, and Timed.

    Fast

    Tests should be fast. How much? Enough to don’t discourage the developers to run them. This property applies only to Unit Tests: in fact, while each test should run in less than 1 second, you may have some Integration and E2E tests that take more than 10 seconds – it depends on what you’re testing.

    Now, imagine if you have to update one class (or one method), and you have to re-run all your tests. If the whole tests suite takes just a few seconds, you can run them whenever you want – some devs run all the tests every time they hit Save; if every single test takes 1 second to run, and you have 200 tests, just a simple update to one class makes you lose at least 200 seconds: more than 3 minutes. Yes, I know that you can run them in parallel, but that’s not the point!

    So, keep your tests short and fast.

    Independent

    Every test method must be independent of the other tests.

    This means that the result and the execution of one method must not impact the execution of another one. Conversely, one method must not rely on the execution of another method.

    A concrete example?

    public class MyTests
    {
        string userName = "Lenny";
    
        [Test]
        public void Test1()
        {
            Assert.AreEqual("Lenny", userName);
            userName = "Carl";
    
        }
    
        [Test]
        public void Test2()
        {
            Assert.AreEqual("Carl", userName);
        }
    
    }
    

    Those tests are perfectly valid if run in sequence. But Test1 affects the execution of Test2 by setting a global variable
    used by the second method. But what happens if you run only Test2? It will fail. Same result if the tests are run in a different order.

    So, you can transform the previous method in this way:

    public class MyTests
    {
        string userName;
    
        [SetUp]
        public void Setup()
        {
            userName = "Boe";
        }
    
        [Test]
        public void Test1()
        {
            userName = "Lenny";
            Assert.AreEqual("Lenny", userName);
    
        }
    
        [Test]
        public void Test2()
        {
            userName = "Carl";
            Assert.AreEqual("Carl", userName);
        }
    
    }
    

    In this way, we have a default value, Boe, that gets overridden by the single methods – only when needed.

    Repeatable

    Every Unit test must be repeatable: this means that you must be able to run them at any moment and on every machine (and get always the same result).

    So, avoid all the strong dependencies on your machine (like file names, absolute paths, and so on), and everything that is not directly under your control: the current date and time, random-generated numbers, and GUIDs.

    To work with them there’s only a solution: abstract them and use a mocking mechanism.

    If you want to learn 3 ways to do this, check out my 3 ways to inject DateTime and test it. There I explained how to inject DateTime, but the same approaches work even for GUIDs and random numbers.

    Self-validating

    You must be able to see the result of a test without performing more actions by yourself.

    So, don’t write your test results on an external file or source, and don’t put breakpoints on your tests to see if they’ve passed.

    Just put meaningful assertions and let your framework (and IDE) tell you the result.

    Timely

    You must write your tests when required. Usually, when using TDD, you write your tests right before your production code.

    So, this particular property applies only to devs who use TDD.

    Wrapping up

    In this article, we’ve seen that even if many developers consider tests redundant and not worthy of attention, they are first-class citizens of our applications.

    Paying enough attention to tests brings us a lot of advantages:

    • tests document our code, thus helping onboarding new developers
    • they help us deploy with confidence a new version of our product, without worrying about regressions
    • they prove that our code has no bugs (well, actually you’ll always have a few bugs, it’s just that you haven’t discovered them yet )
    • code becomes more flexible and can be extended without too many worries

    So, write meaningful tests, and always well written.

    Quality over quantity, always!

    Happy coding!


    Source link

  • how to view Code Coverage report on Azure DevOps | Code4IT


    Code coverage is a good indicator of the health of your projects. We’ll see how to show Cobertura reports associated to your builds on Azure DevOps and how to display the progress on Dashboard.

    Table of Contents

    Just a second! 🫷
    If you are here, it means that you are a software developer.
    So, you know that storage, networking, and domain management have a cost .

    If you want to support this blog, please ensure that you have disabled the adblocker for this site.
    I configured Google AdSense to show as few ADS as possible – I don’t want to bother you with lots of ads, but I still need to add some to pay for the resources for my site.

    Thank you for your understanding.
    Davide

    Code coverage is a good indicator of the health of your project: the more your project is covered by tests, the lesser are the probabilities that you have easy-to-find bugs in it.

    Even though 100% of code coverage is a good result, it is not enough: you have to check if your tests are meaningful and bring value to the project; it really doesn’t make any sense to cover each line of your production code with tests valid only for the happy path; you also have to cover the edge cases!

    But, even if it’s not enough, having an idea of the code coverage on your project is a good practice: it helps you understanding where you should write more tests and, eventually, help you removing some bugs.

    In a previous article, we’ve seen how to use Coverlet and Cobertura to view the code coverage report on Visual Studio (of course, for .NET projects).

    In this article, we’re gonna see how to show that report on Azure DevOps: by using a specific command (or, even better, a set of flags) on your YAML pipeline definition, we are going to display that report for every build we run on Azure DevOps. This simple addition will help you see the status of a specific build and, if it’s the case, update the code to add more tests.

    Then, in the second part of this article, we’re gonna see how to view the coverage history on your Azure DevOps dashboard, by using a plugin called Code Coverage Protector.

    But first, let’s start with the YAML pipelines!

    Coverlet – the NuGet package for code coverage

    As already explained in my previous article, the very first thing to do to add code coverage calculation is to install a NuGet package called Coverlet. This package must be installed in every test project in your Solution.

    So, running a simple dotnet add package coverlet.msbuild on your test projects is enough!

    Create YAML tasks to add code coverage

    Once we have Coverlet installed, it’s time to add the code coverage evaluation to the CI pipeline.

    We need to add two steps to our YAML file: one for collecting the code coverage on test projects, and one for actually publishing it.

    Run tests and collect code coverage results

    Since we are working with .NET Core applications, we need to use a DotNetCoreCLI@2 task to run dotnet test. But we need to specify some attributes: in the arguments field, add /p:CollectCoverage=true to tell the task to collect code coverage results, and /p:CoverletOutputFormat=cobertura to specify which kind of code coverage format we want to receive as output.

    The task will have this form:

    - task: DotNetCoreCLI@2
      displayName: "Run tests"
      inputs:
        command: "test"
        projects: "**/*[Tt]est*/*.csproj"
        publishTestResults: true
        arguments: "--configuration $(buildConfiguration) /p:CollectCoverage=true /p:CoverletOutputFormat=cobertura"
    

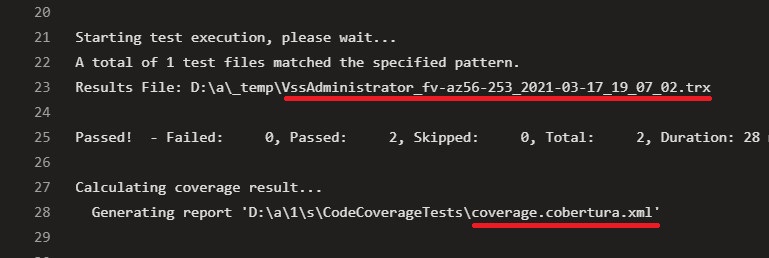
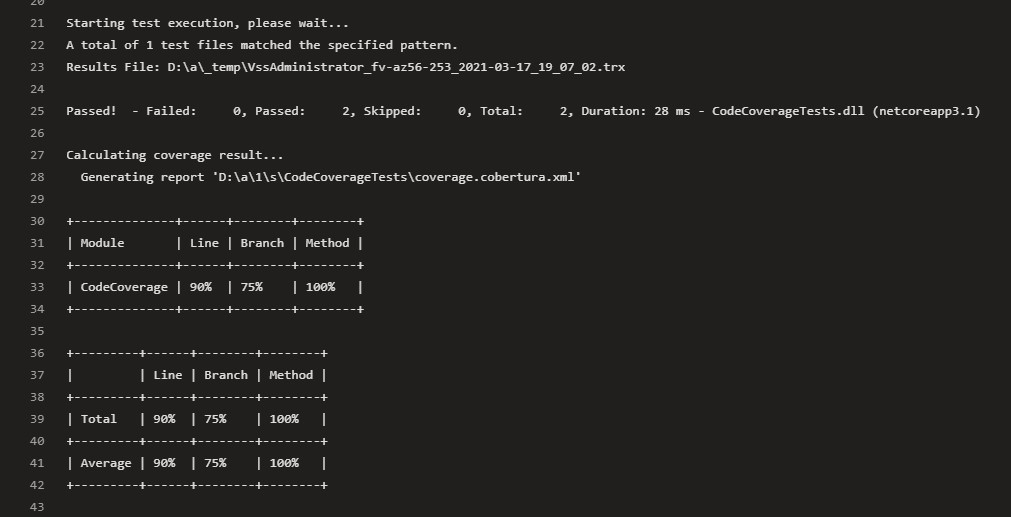
    You can see the code coverage preview directly in the log panel of the executing build. The ASCII table tells you the code coverage percentage for each module, specifying the lines, branches, and methods covered by tests for every module.

    Logging dotnet test

    Another interesting thing to notice is that this task generates two files: a trx file, that contains the test results info (which tests passed, which ones failed, and other info), and a coverage.cobertura.xml, that is the file we will use in the next step to publish the coverage results.

    dotnet test generated files

    Publish code coverage results

    Now that we have the coverage.cobertura.xml file, the last thing to do is to publish it.

    Create a task of type PublishCodeCoverageResults@1, specify that the result format is Cobertura, and then specify the location of the file to be published.

    - task: PublishCodeCoverageResults@1
      displayName: "Publish code coverage results"
      inputs:
        codeCoverageTool: "Cobertura"
        summaryFileLocation: "**/*coverage.cobertura.xml"
    

    Final result

    Now that we know what are the tasks to add, we can write the most basic version of a build pipeline:

    trigger:
      - master
    
    pool:
      vmImage: "windows-latest"
    
    variables:
      solution: "**/*.sln"
      buildPlatform: "Any CPU"
      buildConfiguration: "Release"
    
    steps:
      - task: DotNetCoreCLI@2
        displayName: "Build"
        inputs:
          command: "build"
      - task: DotNetCoreCLI@2
        displayName: "Run tests"
        inputs:
          command: "test"
          projects: "**/*[Tt]est*/*.csproj"
          publishTestResults: true
          arguments: "--configuration $(buildConfiguration) /p:CollectCoverage=true /p:CoverletOutputFormat=cobertura"
      - task: PublishCodeCoverageResults@1
        displayName: "Publish code coverage results"
        inputs:
          codeCoverageTool: "Cobertura"
          summaryFileLocation: "**/*coverage.cobertura.xml"
    

    So, here, we simply build the solution, run the tests and publish both test and code coverage results.

    Where can we see the results?

    If we go to the build execution details, we can see the tests and coverage results under the Tests and coverage section.

    Build summary panel

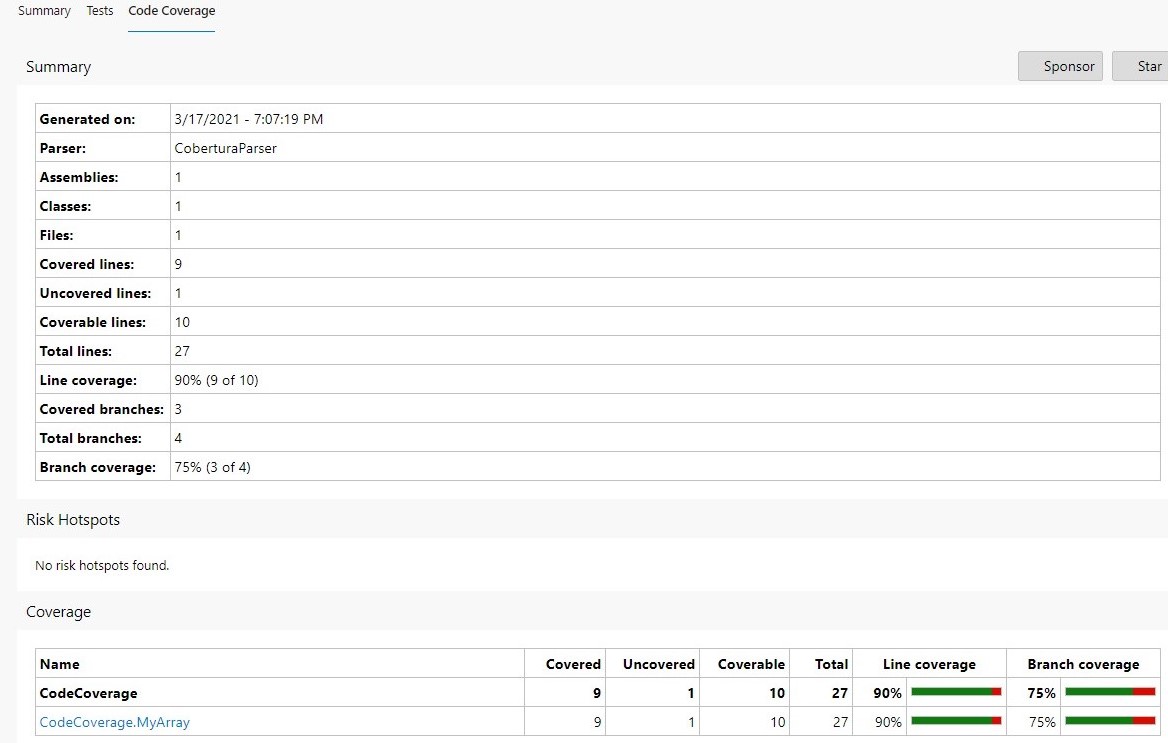
    By clicking on the Code Coverage tab, we can jump to the full report, where we can see how many lines and branches we have covered.

    Test coverage report

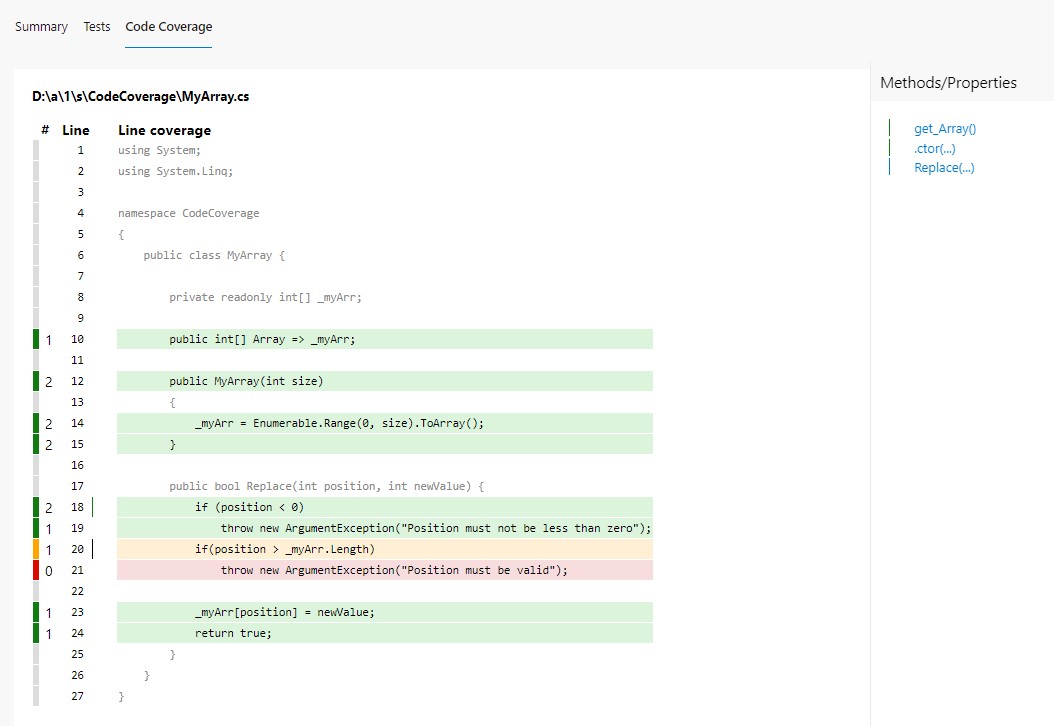
    And then, when we click on a class (in this case, CodeCoverage.MyArray), you can navigate to the class details to see which lines have been covered by tests.

    Test coverage details on the MyArray class

    Code Coverage Protector: an Azure DevOps plugin

    Now what? We should keep track of the code coverage percentage over time. But open every Build execution to see the progress is not a good idea, isn’t it? We should find another way to see the progress.

    A really useful plugin to manage this use case is Code Coverage Protector, developed by Dave Smits: among other things, it allows you to display the status of code coverage directly on your Azure DevOps Dashboards.

    To install it, head to the plugin page on the marketplace and click get it free.

    &ldquo;Code Coverage Protector plugin&rdquo;

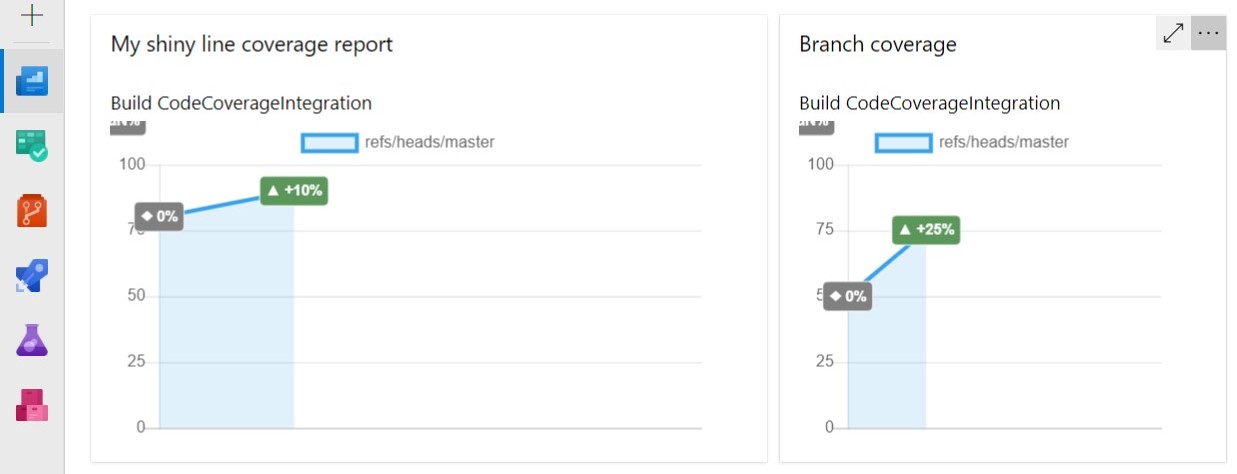
    Once you have installed it, you can add one or more of its widgets to your project’s Dashboard, define which Build pipeline it must refer to, select which metric must be taken into consideration (line, branch, class, and so on), and set up a few other options (like the size of the widget).

    &ldquo;Code Coverage Protector widget on Azure Dashboard&rdquo;

    So, now, with just one look you can see the progress of your project.

    Wrapping up

    In this article, we’ve seen how to publish code coverage reports for .NET applications on Azure DevOps. We’ve used Cobertura and Coverlet to generate the reports, some YAML configurations to show them in the related build panel, and Code Coverage Protector to show the progress in your Azure DevOps dashboard.

    If you want to do one further step, you could use Code Coverage Protector as a build step to make your builds fail if the current Code Coverage percentage is less than the one from the previous builds.

    Happy coding!


    Source link

  • performance or clean code? | Code4IT


    In any application, writing code that is clean and performant is crucial. But we often can’t have both. What to choose?

    Table of Contents

    Just a second! 🫷
    If you are here, it means that you are a software developer.
    So, you know that storage, networking, and domain management have a cost .

    If you want to support this blog, please ensure that you have disabled the adblocker for this site.
    I configured Google AdSense to show as few ADS as possible – I don’t want to bother you with lots of ads, but I still need to add some to pay for the resources for my site.

    Thank you for your understanding.
    Davide

    A few weeks ago I had a nice discussion on Twitter with Visakh Vijayan about the importance of clean code when compared to performance.

    The idea that triggered that discussion comes from a Tweet by Daniel Moka

    Wrap long conditions!

    A condition statement with multiple booleans makes your code harder to read.

    The longer a piece of code is, the more difficult it is to understand.

    It’s better to extract the condition into a well-named function that reveals the intent.

    with an example that showed how much easier is to understand an if statement when the condition evaluation is moved to a different, well-named function, rather than keeping the same condition directly in the if statement.

    So, for example:

    if(hasValidAge(user)){...}
    
    bool hasValidAge(User user)
    {
        return user.Age>= 18 && user.Age < 100;
    }
    

    is much easier to read than

    if(user.Age>= 18 && user.Age < 100){...}
    

    I totally agree with him. But then, I noticed Visakh’s point of view:

    If this thing runs in a loop, it just got a whole lot more function calls which is basically an added operation of stack push-pop.

    He’s actually right! Clearly, the way we write our code affects our application’s performance.

    So, what should be a developer’s focus? Performance or Clean code?

    In my opinion, clean code. But let’s see the different points of view.

    In favor of performance

    Obviously, an application of whichever type must be performant. Would you use prefer a slower or a faster application?

    So, we should optimize performance to the limit because:

    • every nanosecond is important
    • memory is a finite resource
    • final users are the most important users of our application

    This means that every useless stack allocation, variable, loop iteration, should be avoided. We should bring our applications to the limits.

    Another Visakh’s good point from that thread was that

    You don’t keep reading something every day … The code gets executed every day though. I would prefer performance over readability any day. Obviously with decent readability tho.

    And, again, that is true: we often write our code, test it, and never touch it again; but the application generated by our code is used every day by end-users, so our choices impact their day-by-day experience with the application.

    Visakh’s points are true. But yet I don’t agree with him. Let’s see why.

    In favor of clean code

    First of all, let’s break a myth: end user is not the final user of our code: the dev team is. A user can totally ignore how the dev team implemented their application. C#, JavaScript, Python? TDD, BDD, AOD? They will never know (unless the source code is online). So, end users are not affected by our code: they are affected by the result of the compilation of our code.

    This means that we should not write good code for them, but for ourselves.

    But, to retain users in the long run, we should focus on another aspect: maintainability.

    Given this IEEE definition of maintainability,

    a program is maintainable if it meets the following two conditions:

    • There is a high probability of determining the cause of a problem in a timely manner the first time it occurs,

    • There is a high probability of being able to modify the program without causing an error in some other part of the program.

    so, simplifying the definition, we should be able to:

    • easily identify and fix bugs
    • easily add new features

    In particular, splitting the code into different methods helps you identify bugs because:

    • the code is easier to read, as if it was a novel;
    • in C#, we can easily identify which method threw an Exception, by looking at the stack trace details.

    To demonstrate the first point, let’s read again the two snippets at the beginning of this article.

    When skimming the code, you may incur in this code:

    if(hasValidAge(user)){...}
    

    or in this one:

    if(user.Age>= 18 && user.Age < 100){...}
    

    The former gives you clearly the idea of what’s going on. If you are interested in the details, you can simply jump to the definition of hasValidAge.

    The latter forces you to understand the meaning of that condition, even if it’s not important to you – without reading it first, how would you know if it is important to you?

    And what if user was null and an exception is thrown? With the first way, the stack trace info will hint you to look at the hasValidAge method. With the second way, you have to debug the whole application to get to those breaking instructions.

    So, clean code helps you fixing bugs and then providing a more reliable application to your users.

    But they will lose some ns because of stack allocation. Do they?

    Benchmarking inline instructions vs nested methods

    The best thing to do when in doubt about performance is… to run a benchmark.

    As usual, I’ve created a benchmark with BenchmarkDotNet. I’ve already explained how to get started with it in this article, and I’ve used it to benchmark loops performances in C# in this other article.

    So, let’s see the two benchmarked methods.

    Note: those operations actually do not make any sense. They are there only to see how the stack allocation affects performance.

    The first method under test is the one with all the operations on a single level, without nested methods:

    [Benchmark]
    [ArgumentsSource(nameof(Arrays))]
    public void WithSingleLevel(int[] array)
    {
        PerformOperationsWithSingleLevel(array);
    }
    
    private void PerformOperationsWithSingleLevel(int[] array)
    {
        int[] filteredNumbers = array.Where(n => n % 12 != 0).ToArray();
    
        foreach (var number in filteredNumbers)
        {
            string status = "";
            var isOnDb = number % 3 == 0;
            if (isOnDb)
            {
                status = "onDB";
            }
            else
            {
                var isOnCache = (number + 1) % 7 == 0;
                if (isOnCache)
                {
                    status = "onCache";
                }
                else
                {
                    status = "toBeCreated";
                }
            }
        }
    }
    

    No additional calls, no stack allocations.

    The other method under test does the same thing, but exaggerating the method calls:

    
    [Benchmark]
    [ArgumentsSource(nameof(Arrays))]
    public void WithNestedLevels(int[] array)
    {
        PerformOperationsWithMultipleLevels(array);
    }
    
    private void PerformOperationsWithMultipleLevels(int[] array)
    {
        int[] filteredNumbers = GetFilteredNumbers(array);
    
        foreach (var number in filteredNumbers)
        {
            CalculateStatus(number);
        }
    }
    
    private static void CalculateStatus(int number)
    {
        string status = "";
        var isOnDb = IsOnDb(number);
        status = isOnDb ? GetOnDBStatus() : GetNotOnDbStatus(number);
    }
    
    private static string GetNotOnDbStatus(int number)
    {
        var isOnCache = IsOnCache(number);
        return isOnCache ? GetOnCacheStatus() : GetToBeCreatedStatus();
    }
    
    private static string GetToBeCreatedStatus() => "toBeCreated";
    
    private static string GetOnCacheStatus() => "onCache";
    
    private static bool IsOnCache(int number) => (number + 1) % 7 == 0;
    
    private static string GetOnDBStatus() => "onDB";
    
    private static bool IsOnDb(int number) => number % 3 == 0;
    
    private static int[] GetFilteredNumbers(int[] array) => array.Where(n => n % 12 != 0).ToArray();
    

    Almost everything is a function.

    And here’s the result of that benchmark:

    Method array Mean Error StdDev Median
    WithSingleLevel Int32[10000] 46,384.6 ns 773.95 ns 1,997.82 ns 45,605.9 ns
    WithNestedLevels Int32[10000] 58,912.2 ns 1,152.96 ns 1,539.16 ns 58,536.7 ns
    WithSingleLevel Int32[1000] 5,184.9 ns 100.54 ns 89.12 ns 5,160.7 ns
    WithNestedLevels Int32[1000] 6,557.1 ns 128.84 ns 153.37 ns 6,529.2 ns
    WithSingleLevel Int32[100] 781.0 ns 18.54 ns 51.99 ns 764.3 ns
    WithNestedLevels Int32[100] 910.5 ns 17.03 ns 31.98 ns 901.5 ns
    WithSingleLevel Int32[10] 186.7 ns 3.71 ns 9.43 ns 182.9 ns
    WithNestedLevels Int32[10] 193.5 ns 2.48 ns 2.07 ns 193.7 ns

    As you see, by increasing the size of the input array, the difference between using nested levels and staying on a single level increases too.

    But for arrays with 10 items, the difference is 7 nanoseconds (0.000000007 seconds).

    For arrays with 10000 items, the difference is 12528 nanoseconds (0.000012528 seconds).

    I don’t think the end user will ever notice that every operation is performed without calling nested methods. But the developer that has to maintain the code, he surely will.

    Conclusion

    As always, we must find a balance between clean code and performance: you should not write an incredibly elegant piece of code that takes 3 seconds to complete an operation that, using a dirtier approach, would have taken a bunch of milliseconds.

    Also, remember that the quality of the code affects the dev team, which must maintain that code. If the application uses every ns available, but it’s full of bugs, users will surely complain (and stop using it).

    So, write code for your future self and for your team, not for the average user.

    Of course, that is my opinion. Drop a message in the comment section, or reach me on Twitter!

    Happy coding!
    🐧


    Source link

  • XGBoost for beginners – from CSV to Trustworthy Model – Useful code


    import numpy as np

    import pandas as pd

    import xgboost as xgb


    from sklearn.model_selection import train_test_split

    from sklearn.metrics import (

        confusion_matrix, precision_score, recall_score,

        roc_auc_score, average_precision_score, precision_recall_curve

    )


    # 1) Load a tiny cusomer churn CSV called churn.csv 

    df = pd.read_csv(“churn.csv”)


    # 2) Do quick, safe checks – missing values and class balance.

    missing_share = df.isna().mean().sort_values(ascending=False)

    class_share = df[“churn”].value_counts(normalize=True).rename(“share”)

    print(“Missing share (top 5):\n”, missing_share.head(5), “\n”)

    print(“Class share:\n”, class_share, “\n”)


    # 3) Split data into train, validation, test – 60-20-20.

    X = df.drop(columns=[“churn”]); y = df[“churn”]

    X_tr, X_te, y_tr, y_te = train_test_split(X, y, test_size=0.20, stratify=y, random_state=13)

    X_tr, X_va, y_tr, y_va = train_test_split(X_tr, y_tr, test_size=0.25, stratify=y_tr, random_state=13)

    neg, pos = int((y_tr==0).sum()), int((y_tr==1).sum())

    spw = neg / max(pos, 1)

    print(f“Shapes -> train {X_tr.shape}, val {X_va.shape}, test {X_te.shape}”)

    print(f“Class balance in train -> neg {neg}, pos {pos}, scale_pos_weight {spw:.2f}\n”)


    # Wrap as DMatrix (fast internal format)

    feat_names = list(X.columns)

    dtr = xgb.DMatrix(X_tr, label=y_tr, feature_names=feat_names)

    dva = xgb.DMatrix(X_va, label=y_va, feature_names=feat_names)

    dte = xgb.DMatrix(X_te, label=y_te, feature_names=feat_names)


    # 4) Train XGBoost with early stopping using the Booster API.

    params = dict(

        objective=“binary:logistic”,

        eval_metric=“aucpr”,

        tree_method=“hist”,

        max_depth=5,

        eta=0.03,

        subsample=0.8,

        colsample_bytree=0.8,

        reg_lambda=1.0,

        scale_pos_weight=spw

    )

    bst = xgb.train(params, dtr, num_boost_round=4000, evals=[(dva, “val”)],

                    early_stopping_rounds=200, verbose_eval=False)

    print(“Best trees (baseline):”, bst.best_iteration)


    # 6) Choose a practical decision treshold from validation – “a line in the sand”.

    p_va = bst.predict(dva, iteration_range=(0, bst.best_iteration + 1))

    pre, rec, thr = precision_recall_curve(y_va, p_va)

    f1 = 2 * pre * rec / np.clip(pre + rec, 1e9, None)

    t_best = float(thr[np.argmax(f1[:1])])

    print(“Chosen threshold t_best (validation F1):”, round(t_best, 3), “\n”)


    # 7) Explain results on the test set in plain terms – confusion matrix, precision, recall, ROC AUC, PR AUC

    p_te = bst.predict(dte, iteration_range=(0, bst.best_iteration + 1))

    pred = (p_te >= t_best).astype(int)

    cm = confusion_matrix(y_te, pred)

    print(“Confusion matrix:\n”, cm)

    print(“Precision:”, round(precision_score(y_te, pred), 3))

    print(“Recall   :”, round(recall_score(y_te, pred), 3))

    print(“ROC AUC  :”, round(roc_auc_score(y_te, p_te), 3))

    print(“PR  AUC  :”, round(average_precision_score(y_te, p_te), 3), “\n”)


    # 8) See which column mattered most

    # (a hint – if people start calling the call centre a lot, most probably there is a problem and they will quit using your service)

    imp = pd.Series(bst.get_score(importance_type=“gain”)).sort_values(ascending=False)

    print(“Top features by importance (gain):\n”, imp.head(10), “\n”)


    # 9) Add two business rules with monotonic constraints

    cons = [0]*len(feat_names)

    if “debt_ratio” in feat_names: cons[feat_names.index(“debt_ratio”)] = 1     # non-decreasing

    if “tenure_months” in feat_names: cons[feat_names.index(“tenure_months”)] = 1  # non-increasing

    mono = “(“ + “,”.join(map(str, cons)) + “)”


    params_cons = params.copy()

    params_cons.update({“monotone_constraints”: mono, “max_bin”: 512})


    bst_cons = xgb.train(params_cons, dtr, num_boost_round=4000, evals=[(dva, “val”)],

                         early_stopping_rounds=200, verbose_eval=False)

    print(“Best trees (constrained):”, bst_cons.best_iteration)


    # 10) Compare the quality of bst_cons and bst with a few lines.

    p_cons = bst_cons.predict(dte, iteration_range=(0, bst_cons.best_iteration + 1))

    print(“PR AUC  baseline vs constrained:”, round(average_precision_score(y_te, p_te), 3),

          “vs”, round(average_precision_score(y_te, p_cons), 3))

    print(“ROC AUC baseline vs constrained:”, round(roc_auc_score(y_te, p_te), 3),

          “vs”, round(roc_auc_score(y_te, p_cons), 3), “\n”)


    # 11) Save both models

    bst.save_model(“easy_xgb_base.ubj”)

    bst_cons.save_model(“easy_xgb_cons.ubj”)

    print(“Saved models: easy_xgb_base.ubj, easy_xgb_cons.ubj”)


    Source link

  • Profiling .NET code with MiniProfiler | Code4IT


    Is your application slow? How to find bottlenecks? If so, you can use MiniProfiler to profile a .NET API application and analyze the timings of the different operations.

    Table of Contents

    Just a second! 🫷
    If you are here, it means that you are a software developer.
    So, you know that storage, networking, and domain management have a cost .

    If you want to support this blog, please ensure that you have disabled the adblocker for this site.
    I configured Google AdSense to show as few ADS as possible – I don’t want to bother you with lots of ads, but I still need to add some to pay for the resources for my site.

    Thank you for your understanding.
    Davide

    Sometimes your project does not perform well as you would expect. Bottlenecks occur, and it can be hard to understand where and why.

    So, the best thing you should do is to profile your code and analyze the execution time to understand which are the parts that impact the most your application performance.

    In this article, we will learn how to use Miniprofiler to profile code in a .NET 5 API project.

    Setting up the project

    For this article, I’ve created a simple project. This project tells you the average temperature of a place by specifying the country code (eg: IT), and the postal code (eg: 10121, for Turin).

    There is only one endpoint, /Weather, that accepts in input the CountryCode and the PostalCode, and returns the temperature in Celsius.

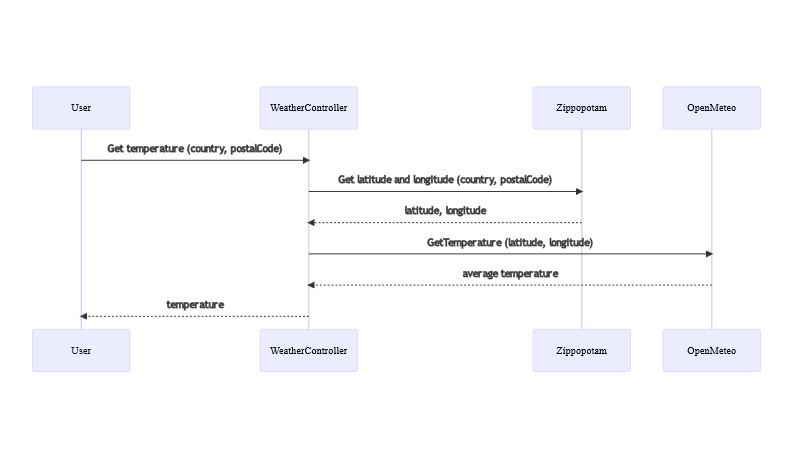
    To retrieve the data, the application calls two external free services: Zippopotam to get the current coordinates, and OpenMeteo to get the daily temperature using those coordinates.

    Sequence diagram

    Let’s see how to profile the code to see the timings of every operation.

    Installing MiniProfiler

    As usual, we need to install a Nuget package: since we are working on a .NET 5 API project, you can install the MiniProfiler.AspNetCore.Mvc package, and you’re good to go.

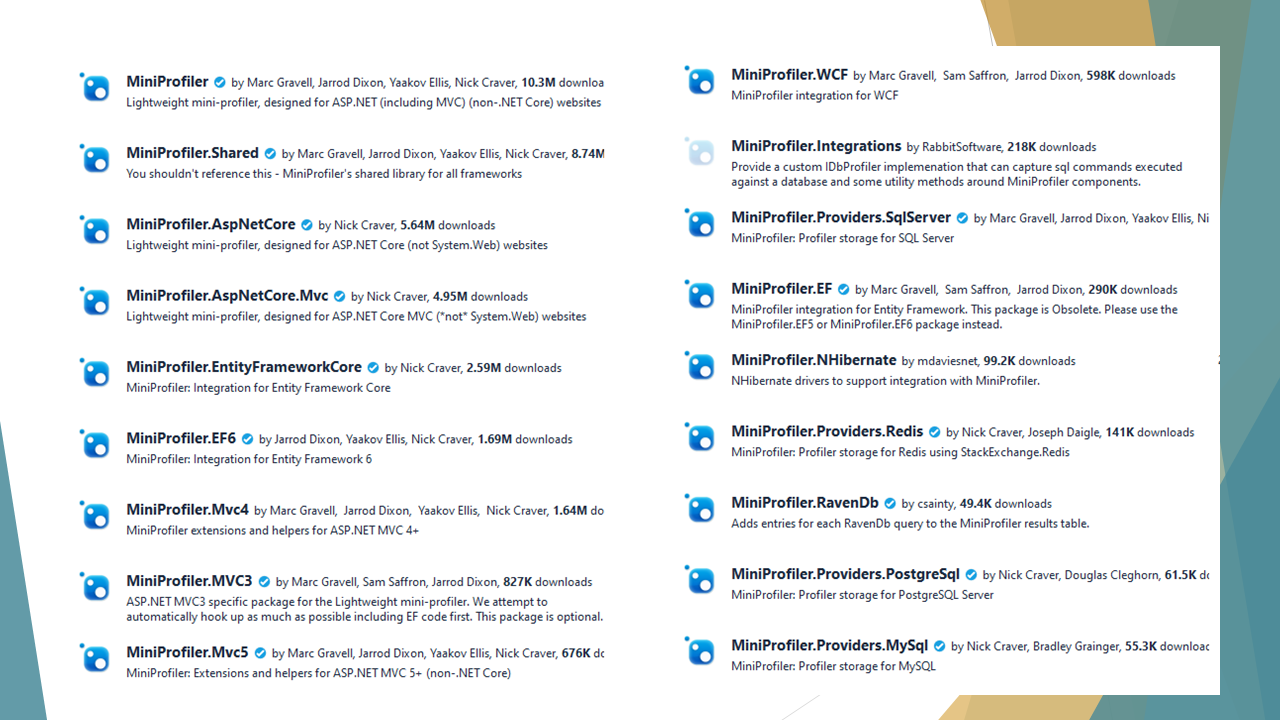
    MiniProfiler provides tons of packages you can use to profile your code: for example, you can profile Entity Framework, Redis, PostgreSql, and more.

    MiniProfiler packages on NuGet

    Once you’ve installed it, we can add it to our project by updating the Startup class.

    In the Configure method, you can simply add MiniProfiler to the ASP.NET pipeline:

    Then, you’ll need to configure it in the ConfigureServices method:

    public void ConfigureServices(IServiceCollection services)
    {
        services.AddMiniProfiler(options =>
            {
                options.RouteBasePath = "/profiler";
                options.ColorScheme = StackExchange.Profiling.ColorScheme.Dark;
            });
    
        services.AddControllers();
        // more...
    }
    

    As you might expect, the king of this method is AddMiniProfiler. It allows you to set MiniProfiler up by configuring an object of type MiniProfilerOptions. There are lots of things you can configure, that you can see on GitHub.

    For this example, I’ve updated the color scheme to use Dark Mode, and I’ve defined the base path of the page that shows the results. The default is mini-profiler-resources, so the results would be available at /mini-profiler-resources/results. With this setting, the result is available at /profiler/results.

    Defining traces

    Time to define our traces!

    When you fire up the application, a MiniProfiler object is created and shared across the project. This object exposes several methods. The most used is Step: it allows you to define a portion of code to profile, by wrapping it into a using block.

    using (MiniProfiler.Current.Step("Getting lat-lng info"))
    {
        (latitude, longitude) = await _locationService.GetLatLng(countryCode, postalCode);
    }
    

    The snippet above defines a step, giving it a name (“Getting lat-lng info”), and profiles everything that happens within those lines of code.

    You can also use nested steps by simply adding a parent step:

    using (MiniProfiler.Current.Step("Get temperature for specified location"))
    {
        using (MiniProfiler.Current.Step("Getting lat-lng info"))
        {
            (latitude, longitude) = await _locationService.GetLatLng(countryCode, postalCode);
        }
    
        using (MiniProfiler.Current.Step("Getting temperature info"))
        {
            temperature = await _weatherService.GetTemperature(latitude, longitude);
        }
    }
    

    In this way, you can create a better structure of traces and perform better analyses. Of course, this method doesn’t know what happens inside the GetLatLng method. If there’s another Step, it will be taken into consideration too.

    You can also use inline steps to trace an operation and return its value on the same line:

    var response = await MiniProfiler.Current.Inline(() => httpClient.GetAsync(fullUrl), "Http call to OpenMeteo");
    

    Inline traces the operation and returns the return value from that method. Notice that it works even for async methods! 🤩

    Viewing the result

    Now that we’ve everything in place, we can run our application.

    To get better data, you should run the application in a specific way.

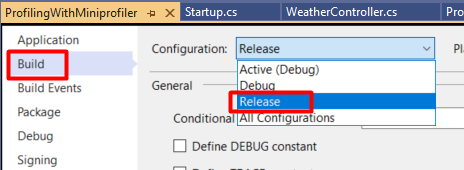
    First of all, use the RELEASE configuration. You can change it in the project properties, heading to the Build tab:

    Visual Studio tab for choosing the build configuration

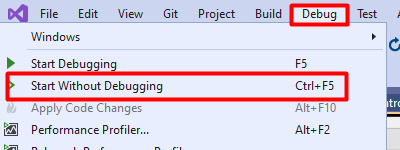
    Then, you should run the application without the debugger attached. You can simply hit Ctrl+F5, or head to the Debug menu and click Start Without Debugging.

    Visual Studio menu to run the application without debugger

    Now, run the application and call the endpoint. Once you’ve got the result, you can navigate to the report page.

    Remember the options.RouteBasePath = "/profiler" option? It’s the one that specifies the path to this page.

    If you head to /profiler/results, you will see a page similar to this one:

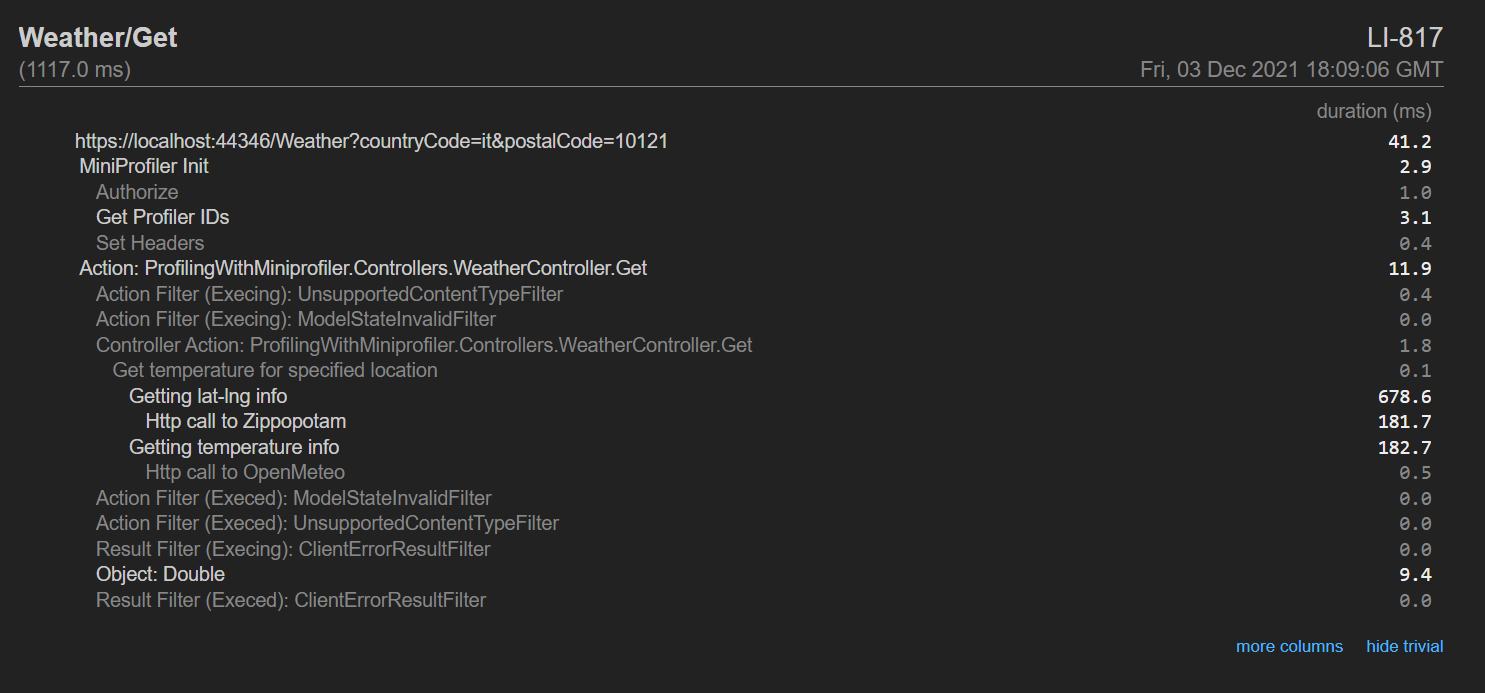
    MiniProfiler results

    On the left column, you can see the hierarchy of the messages we’ve defined in the code. On the right column, you can see the timings for each operation.

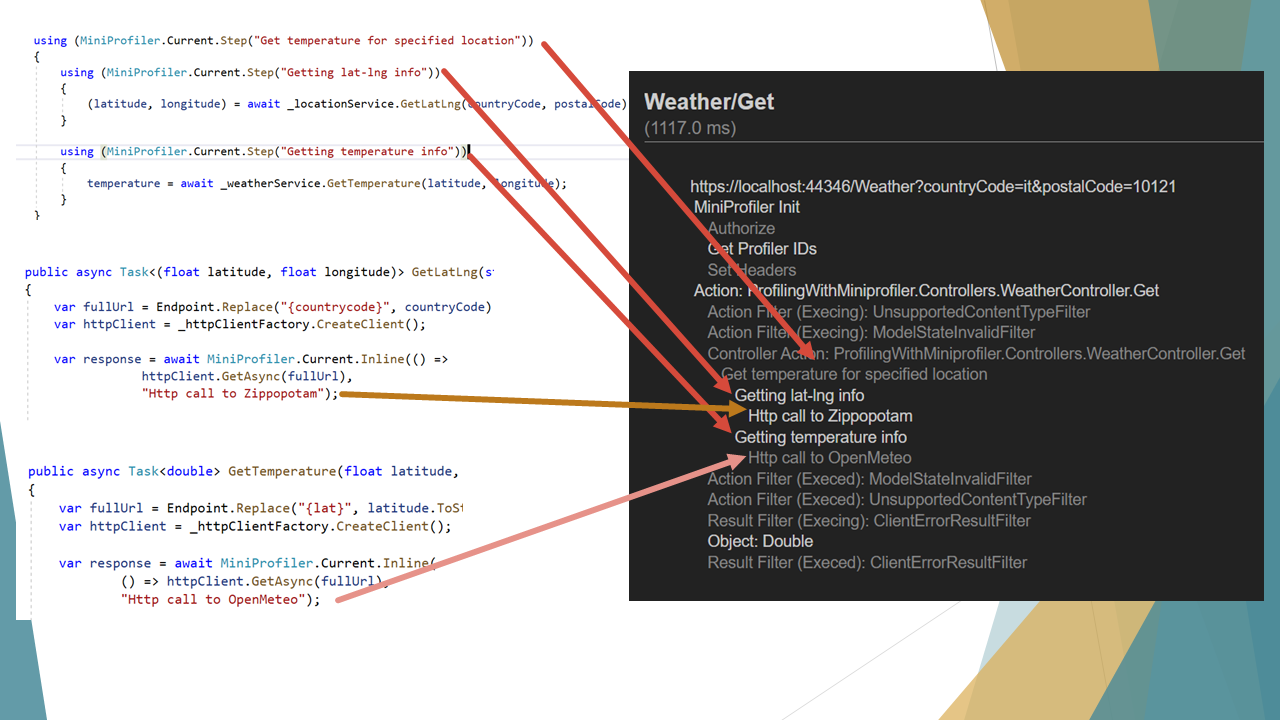
    Association of every MiniProfiler call to the related result

    Noticed that Show trivial button on the bottom-right corner of the report? It displays the operations that took such a small amount of time that can be easily ignored. By clicking on that button, you’ll see many things, such as all the operations that the .NET engine performs to handle your HTTP requests, like the Action Filters.

    Trivial operations on MiniProfiler

    Lastly, the More columns button shows, well… more columns! You will see the aggregate timing (the operation + all its children), and the timing from the beginning of the request.

    More Columns showed on MiniProfiler

    The mystery of x-miniprofiler-ids

    Now, there’s one particular thing that I haven’t understood of MiniProfiler: the meaning of x-miniprofiler-ids.

    This value is an array of IDs that represent every time we’ve profiled something using by MiniProfiler during this session.

    You can find this array in the HTTP response headers:

    x-miniprofiler-ids HTTP header

    I noticed that every time you perform a call to that endpoint, it adds some values to this array.

    My question is: so what? What can we do with those IDs? Can we use them to filter data, or to see the results in some particular ways?

    If you know how to use those IDs, please drop a message in the comments section 👇

    If you want to run this project and play with MiniProfiler, I’ve shared this project on GitHub.

    🔗 ProfilingWithMiniprofiler repository | GitHub

    In this project, I’ve used Zippopotam to retrieve latitude and longitude given a location

    🔗 Zippopotam

    Once I retrieved the coordinates, I used Open Meteo to get the weather info for that position.

    🔗 Open Meteo documentation | OpenMeteo

    And then, obviously, I used MiniProfiler to profile my code.

    🔗 MiniProfiler repository | GitHub

    I’ve already used MiniProfiler for analyzing the performances of an application, and thanks to this library I was able to improve the response time from 14 seconds (yes, seconds!) to less than 3. I’ve explained all the steps in 2 articles.

    🔗 How I improved the performance of an endpoint by 82% – part 1 | Code4IT

    🔗 How I improved the performance of an endpoint by 82% – part 2 | Code4IT

    Wrapping up

    In this article, we’ve seen how we can profile .NET applications using MiniProfiler.

    This NuGet Package works for almost every version of .NET, from the dear old .NET Framework to the most recent one, .NET 6.

    A suggestion: configure it in a way that you can turn it off easily. Maybe using some environment variables. This will give you the possibility to turn it off when this tracing is no more required and to speed up the application.

    Ever used it? Any alternative tools?

    And, most of all, what the f**k is that x-miniprofiler-ids array??😶

    Happy coding!

    🐧


    Source link

  • Correlation – explained with Python – Useful code


    When you plot two variables, you see data dots scattered across the plane. Their overall tilt and shape tell you how the variables move together. Correlation turns that visual impression into a single number you can report and compare.

    What correlation measures

    Correlation summarises the direction and strength of association between two numeric variables on a scale from −1 to +1.

    • Sign shows direction
      • positive – larger x tends to come with larger y
      • negative – larger x tends to come with smaller y
    • Magnitude shows strength
      • near 0 – weak association
      • near 1 in size – strong association

    Correlation does not prove causation.

    Two methods to measure correlation

    Pearson correlation – distance based

    Pearson asks: how straight is the tilt of the data dots? It uses actual distances from a straight line, so it is excellent for line-like patterns and sensitive to outliers. Use when:

    • you expect a roughly straight relationship
    • units and distances matter
    • residuals look symmetric around a line

    Spearman correlation – rank based

    Spearman converts each variable to ranks (1st, 2nd, 3rd, …) and then computes Pearson on those ranks. It measures monotonic association: do higher x values tend to come with higher y values overall, even if the shape is curved.

    Ranks ignore distances and care only about order, which gives two benefits:

    • robust to outliers and weird units
    • invariant to any monotonic transform (log, sqrt, min-max), since order does not change

    Use when:

    • you expect a consistent up or down trend that may be curved
    • the data are ordinal or have many ties
    • outliers are a concern

    r and p in plain language

    • r is the correlation coefficient. It is your effect size on the −1 to +1 scale.
    • p answers: if there were truly no association, how often would we see an r at least this large in magnitude just by random chance.

    Small p flags statistical signal. It is not a measure of importance. Usually findings, where p is bigger than .05 should be ignored.

    When Pearson and Spearman disagree?

    • Curved but monotonic (for example price vs horsepower with diminishing returns)
      Spearman stays high because order increases consistently. Pearson is smaller because a straight line underfits the curve.

    • Outliers (for example a 10-year-old exotic priced very high)
      Pearson can jump because distances change a lot. Spearman changes less because rank order barely changes.

    https://www.youtube.com/watch?v=IdffxjPdNJY

    Jupyter Notebook in GitHub with code from the video above.

    Enjoy it! 🙂


    Source link

  • Python – Learn Pandas with SQL Examples – Football Analytics Example – Useful code

    Python – Learn Pandas with SQL Examples – Football Analytics Example – Useful code


    When working with data, you will often move between SQL databases and Pandas DataFrames. SQL is excellent for storing and retrieving data, while Pandas is ideal for analysis inside Python.

    In this article, we show how both can be used together, using a football (soccer) mini-league dataset. We build a small SQLite database in memory, read the data into Pandas, and then solve real analytics questions.

    There are neither pythons or pandas in Bulgaria. Just software.

    • Setup – SQLite and Pandas

    We start by importing the libraries and creating three tables –
    [teams, players, matches]  inside an SQLite in-memory database.

    Now, we have three tables.

    • Loading SQL Data into Pandas


    pd.read_sql  does the magic to load either a table or a custom query directly.

    At this point, the SQL data is ready for analysis with Pandas.

    • SQL vs Pandas – Filtering Rows

    Task: Find forwards (FW) with more than 1200 minutes on the field:

    SQL:

    Pandas:

    As expected, both return the same subset, one written in SQL and the other in Pandas.

    Task: Total goals per team:

    SQL:

    Pandas:

    Both results show which team has scored more goals overall.

    Task: Add the city of each team to the players table.

    SQL:

    Pandas:

    The fun part: calculating points (3 for a win, 1 for a draw) and goal difference. Only with SQL this time.

    This produces a proper football league ranking – teams sorted by points and then goal difference:

    • Quick Pandas Tricks

      • Top scorers with
        nlargest:

    https://www.youtube.com/watch?v=U0lbBaHFAEM

    https://github.com/Vitosh/Python_personal/tree/master/YouTube/041_Python-Learn-Pandas-with-Football-Analytics


    Source link

  • Docker + Python CRUD API + Excel VBA – All for beginners – Useful code


    import os, sqlite3

    from typing import List, Optional

    from fastapi import FastAPI, HTTPException

    from pydantic import BaseModel


    DB_PATH = os.getenv(“DB_PATH”, “/data/app.db”)  


    app = FastAPI(title=“Minimal Todo CRUD”, description=“Beginner-friendly, zero frontend.”)


    class TodoIn(BaseModel):

        title: str

        completed: bool = False


    class TodoUpdate(BaseModel):

        title: Optional[str] = None

        completed: Optional[bool] = None


    class TodoOut(TodoIn):

        id: int


    def row_to_todo(row) -> TodoOut:

        return TodoOut(id=row[“id”], title=row[“title”], completed=bool(row[“completed”]))


    def get_conn():

        conn = sqlite3.connect(DB_PATH)

        conn.row_factory = sqlite3.Row

        return conn


    @app.on_event(“startup”)

    def init_db():

        os.makedirs(os.path.dirname(DB_PATH), exist_ok=True)

        conn = get_conn()

        conn.execute(“””

            CREATE TABLE IF NOT EXISTS todos(

                id INTEGER PRIMARY KEY AUTOINCREMENT,

                title TEXT NOT NULL,

                completed INTEGER NOT NULL DEFAULT 0

            )

        “””)

        conn.commit(); conn.close()


    @app.post(“/todos”, response_model=TodoOut, status_code=201)

    def create_todo(payload: TodoIn):

        conn = get_conn()

        cur = conn.execute(

            “INSERT INTO todos(title, completed) VALUES(?, ?)”,

            (payload.title, int(payload.completed))

        )

        conn.commit()

        row = conn.execute(“SELECT * FROM todos WHERE id=?”, (cur.lastrowid,)).fetchone()

        conn.close()

        return row_to_todo(row)


    @app.get(“/todos”, response_model=List[TodoOut])

    def list_todos():

        conn = get_conn()

        rows = conn.execute(“SELECT * FROM todos ORDER BY id DESC”).fetchall()

        conn.close()

        return [row_to_todo(r) for r in rows]


    @app.get(“/todos/{todo_id}”, response_model=TodoOut)

    def get_todo(todo_id: int):

        conn = get_conn()

        row = conn.execute(“SELECT * FROM todos WHERE id=?”, (todo_id,)).fetchone()

        conn.close()

        if not row:

            raise HTTPException(404, “Todo not found”)

        return row_to_todo(row)


    @app.patch(“/todos/{todo_id}”, response_model=TodoOut)

    def update_todo(todo_id: int, payload: TodoUpdate):

        data = payload.model_dump(exclude_unset=True)

        if not data:

            return get_todo(todo_id)  # nothing to change


        fields, values = [], []

        if “title” in data:

            fields.append(“title=?”); values.append(data[“title”])

        if “completed” in data:

            fields.append(“completed=?”); values.append(int(data[“completed”]))

        if not fields:

            return get_todo(todo_id)


        conn = get_conn()

        cur = conn.execute(f“UPDATE todos SET {‘, ‘.join(fields)} WHERE id=?”, (*values, todo_id))

        if cur.rowcount == 0:

            conn.close(); raise HTTPException(404, “Todo not found”)

        conn.commit()

        row = conn.execute(“SELECT * FROM todos WHERE id=?”, (todo_id,)).fetchone()

        conn.close()

        return row_to_todo(row)


    @app.delete(“/todos/{todo_id}”, status_code=204)

    def delete_todo(todo_id: int):

        conn = get_conn()

        cur = conn.execute(“DELETE FROM todos WHERE id=?”, (todo_id,))

        conn.commit(); conn.close()

        if cur.rowcount == 0:

            raise HTTPException(404, “Todo not found”)

        return  # 204 No Content


    Source link

  • Tests should be even more well-written than production code &vert; Code4IT

    Tests should be even more well-written than production code | Code4IT


    Just a second! 🫷
    If you are here, it means that you are a software developer.
    So, you know that storage, networking, and domain management have a cost .

    If you want to support this blog, please ensure that you have disabled the adblocker for this site.
    I configured Google AdSense to show as few ADS as possible – I don’t want to bother you with lots of ads, but I still need to add some to pay for the resources for my site.

    Thank you for your understanding.
    Davide

    You surely take care of your code to make it easy to read and understand, right? RIGHT??

    Well done! 👏

    But most of the developers tend to write good production code (the one actually executed by your system), but very poor test code.

    Production code is meant to be run, while tests are also meant to document your code; therefore there must not be doubts about the meaning and the reason behind a test.
    This also means that all the names must be explicit enough to help readers understand how and why a test should pass.

    This is a valid C# test:

    [Test]
    public void TestHtmlParser()
    {
        HtmlDocument doc = new HtmlDocument();
        doc.LoadHtml("<p>Hello</p>");
        var node = doc.DocumentNode.ChildNodes[0];
        var parser = new HtmlParser();
    
        Assert.AreEqual("Hello", parser.ParseContent(node));
    }
    

    What is the meaning of this test? We should be able to understand it just by reading the method name.

    Also, notice that here we are creating the HtmlNode object; imagine if this node creation is present in every test method: you will see the same lines of code over and over again.

    Thus, we can refactor this test in this way:

     [Test]
    public void HtmlParser_ExtractsContent_WhenHtmlIsParagraph()
    {
        //Arrange
        string paragraphContent = "Hello";
        string htmlParagraph = $"<p>{paragraphContent}</p>";
        HtmlNode htmlNode = CreateHtmlNode(htmlParagraph);
        var htmlParser = new HtmlParser();
    
        //Act
        var parsedContent = htmlParser.ParseContent(htmlNode);
    
        //Assert
        Assert.AreEqual(paragraphContent, parsedContent);
    }
    

    This test is definitely better:

    • you can understand its meaning by reading the test name
    • the code is concise, and some creation parts are refactored out
    • we’ve well separated the 3 parts of the tests: Arrange, Act, Assert (we’ve already talked about it here)

    Wrapping up

    Tests are still part of your project, even though they are not used directly by your customers.

    Never skip tests, and never write them in a rush. After all, when you encounter a bug, the first thing you should do is write a test to reproduce the bug, and then validate the fix using that same test.

    So, keep writing good code, for tests too!

    Happy coding!

    🐧


    Source link

  • Exploring SOAP Web Services – From Browser Console to Python – Useful code

    Exploring SOAP Web Services – From Browser Console to Python – Useful code


    SOAP (Simple Object Access Protocol) might sound intimidating (or funny) but it is actually a straightforward way for systems to exchange structured messages using XML. In this article, I am introducing SOAP through YouTube video, where it is explored through 2 different angles – first in the Chrome browser console, then with Python and Jupyter Notebook.

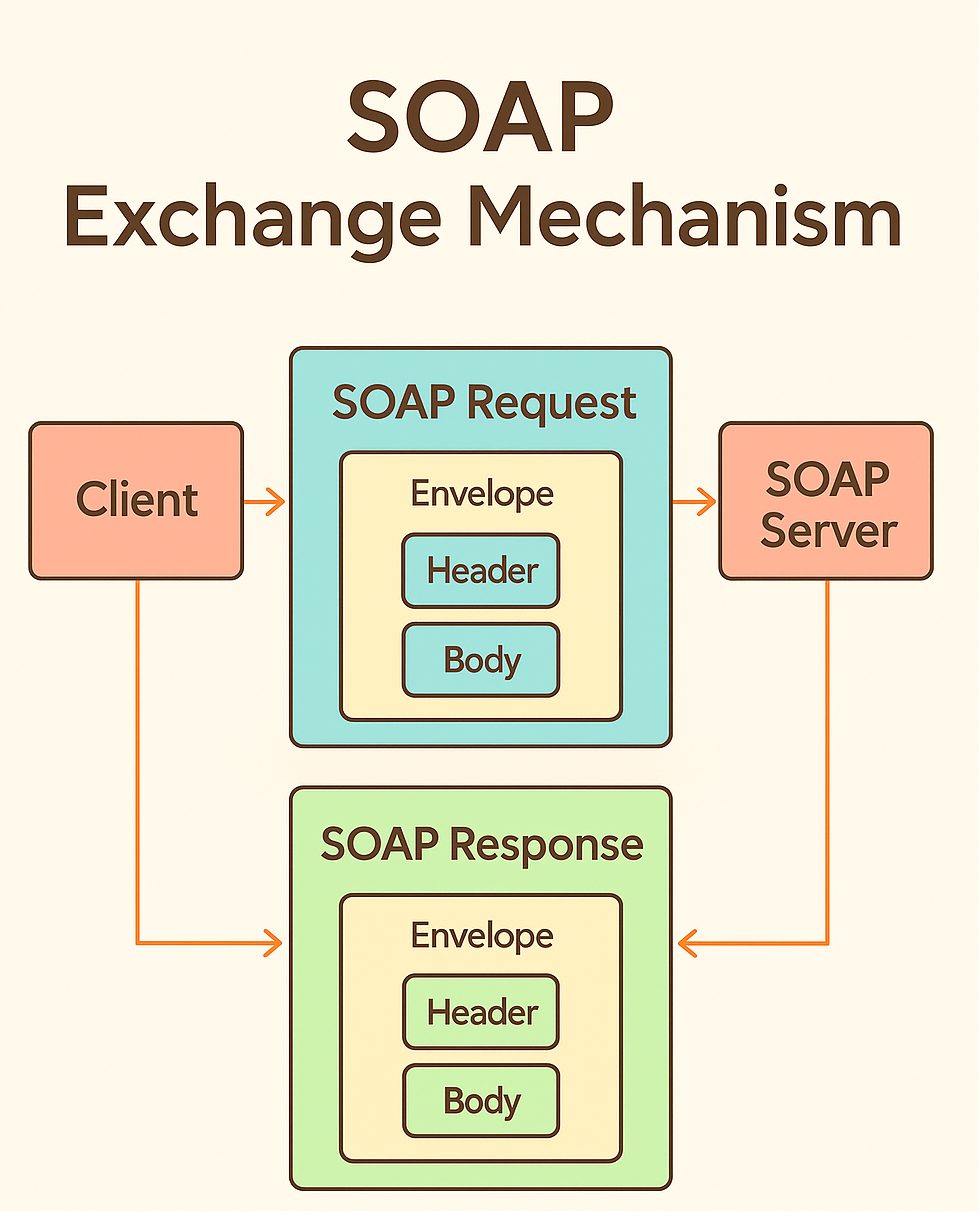
    The SOAP Exchange Mechanism uses requests and response.

    Part 1 – Soap in the Chrome Browser Console

    We start by sending SOAP requests directly from the browser’s JS console. This is a quick way to see the raw XML
    <soap>  envelopes in action. Using a public integer calculator web service, we perform basic operations – additions, subtraction, multiplication, division – and observe how the requests and responses happen in real time!

    For the browser, the entire SOAP journey looks like that:

    Chrome Browser -> HTTP POST -> SOAP XML -> Server (http://www.dneonline.com/calculator.asmx?WSDL) -> SOAP XML -> Chrome Browser

    A simple way to call it is with constants, to avoid the strings:

    Like that:

    Part 2 – Soap with Python and Jupyter Notebook

    Here we jump into Python. With the help of libaries, we load the the WSDL (Web Services Description Language) file, inspect the available operations, and call the same calculator service programmatically.


    https://www.youtube.com/watch?v=rr0r1GmiyZg
    Github code – https://github.com/Vitosh/Python_personal/tree/master/YouTube/038_Python-SOAP-Basics!

    Enjoy it! 🙂


    Source link