Now you can’t run your application because another process already uses the port. How can you find that process? How to kill it?
Table of Contents
Just a second! 🫷 If you are here, it means that you are a software developer.
So, you know that storage, networking, and domain management have a cost .
If you want to support this blog, please ensure that you have disabled the adblocker for this site. I configured Google AdSense to show as few ADS as possible – I don’t want to bother you with lots of ads, but I still need to add some to pay for the resources for my site.
Thank you for your understanding. – Davide
Sometimes, when trying to run your ASP.NET application, there’s something stopping you.
Have you ever found a message like this?
Failed to bind to address https://127.0.0.1:7261: address already in use.
You can try over and over again, you can also restart the application, but the port still appears to be used by another process.
How can you find the process that is running on a local port? How can you kill it to free up the port and, eventually, be able to run your application?
In this article, we will learn how to find the blocking port in Windows 10 and Windows 11, and then we will learn how to kill that process given its PID.
How to find the process running on a port on Windows 11 using PowerShell
Let’s see how to identify the process that is running on port 7261.
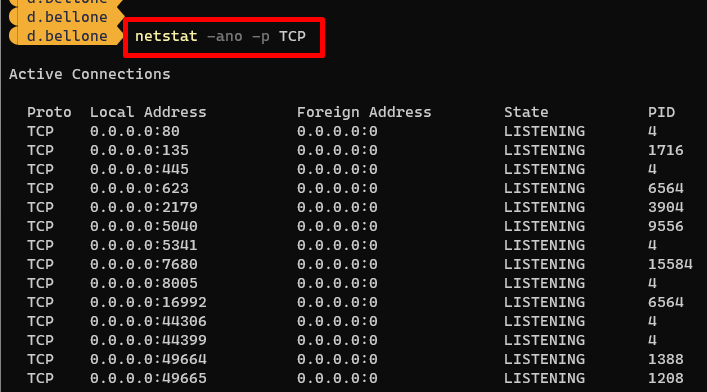
Open a PowerShell and run the netstat command:
NETSTAT is a command that shows info about the active TCP/IP network connections. It accepts several options. In this case, we will use:
-n: Displays addresses and port numbers in numerical form.
-o: Displays the owning process ID associated with each connection.
-a: Displays all connections and listening ports;
-p: Filter for a specific protocol (TCP or UDP)
Notice that the last column lists the PID (Process ID) bound to each connection.
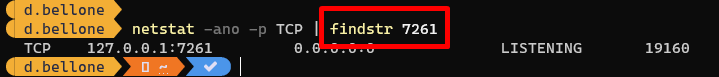
From here, we can use the findstr command to get only the rows with a specific string (the searched port number).
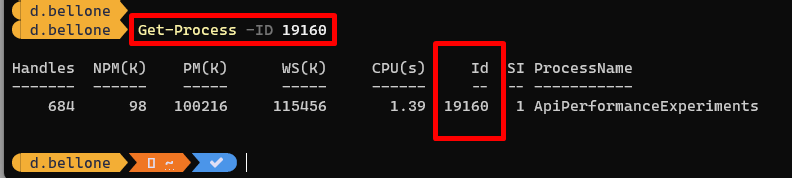
netstat -noa -p TCP | findstr 7261
Now, by looking at the last column, we can identify the Process ID: 19160.
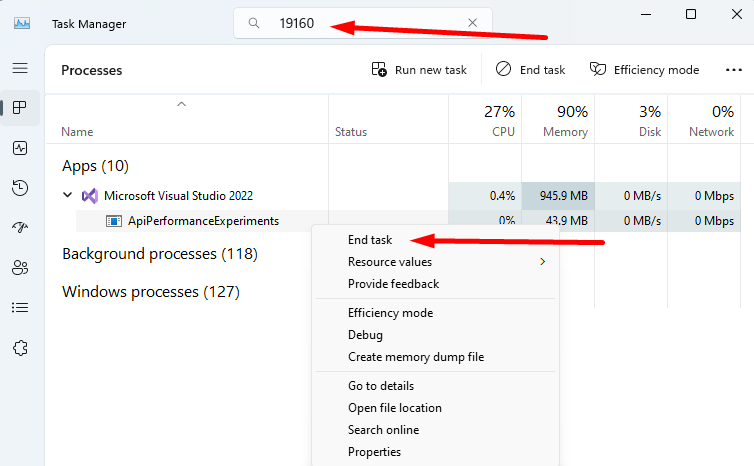
How to kill a process given its PID on Windows or PowerShell
Now that we have the Process ID (PID), we can open the Task Manager, paste the PID value in the topmost textbox, and find the related application.
In our case, it was an instance of Visual Studio running an API application. We can now kill the process by hitting End Task.
If you prefer working with PowerShell, you can find the details of the related process by using the Get-Process command:
Then, you can use the taskkill command by specifying the PID, using the /PID flag, and adding the /F flag to force the killing of the process.
We have killed the process related to the running application. Visual Studio is still working, of course.
Further readings
Hey, what are these fancy colours on the PowerShell?
It’s a customization I added to show the current folder and the info about the associated GIT repository. It’s incredibly useful while developing and navigating the file system with PowerShell.
Rendering text in WebGL opens up a whole new world of unique visual effects and creative possibilities that are often
impossible to achieve with traditional HTML, CSS and JavaScript alone. By the end of this tutorial, we’ll have created
WebGL-rendered text elements that perfectly mimic the underlying HTML structure. Since we’ll be taking an HTML-first
approach, it will be responsive, SEO-friendly and accessible. We’ll be doing every step manually so you’ll gain a
solid understanding of the principles behind merging HTML and WebGL, and text-specific stuff like how to translate CSS
styles into the 3D world.
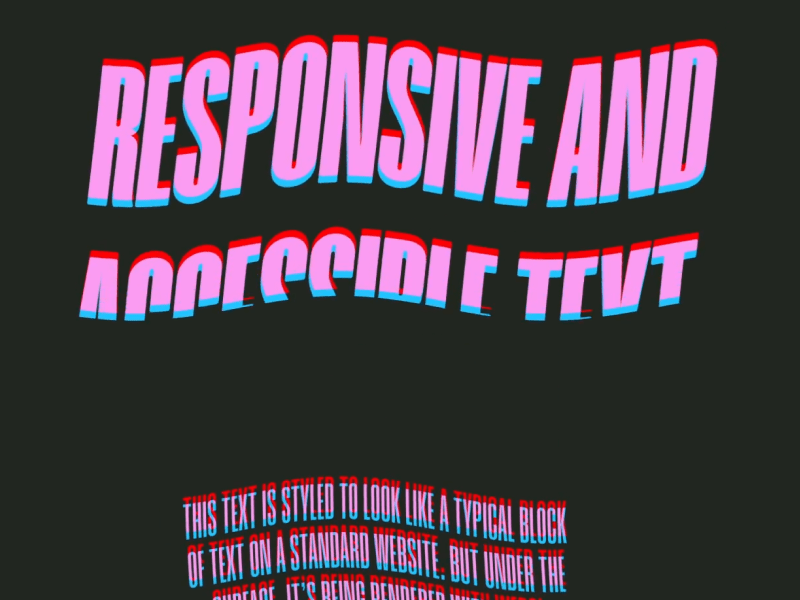
We’ll be creating the below demo:
We’ll start off with a standard styled HTML setup. Then we’ll recreate the text elements we have inside a 3D world.
From there, we’ll position, scale and make the text responsive with the 3D space. Next, we’ll replicate the “mask
reveal effect” in WebGL. And finally, we’ll apply some scroll-driven post processing effects to the scene.
Below are the core steps we’ll follow to achieve the final result:
Create the text as a HTML element and style it regularly using CSS
Create a 3D world and recreate the text element within it
Merge the 3D and 2D world, so that we can style the 3D text by using our viewport’s dimensions
Sync the key properties like position, size and font — from the HTML element to the WebGL text element
Hide the original HTML element
Be left with only the 3D text, fully styled and positioned in sync with the hidden HTML structure
Apply animations and post-processing to enhance our 3D scene
Necessities and Prerequisites
We’ll be using the Three.js library to create the 3D world, so you should already be familiar with its basics. For the
creation of text meshes, we’ll be using the troika-three-text
library, but you don’t have to be familiar with the library beforehand. If you’ve used HTML, CSS and JavaScript, know the basics of Three.JS,
you’re good to go.
Let’s get started.
1. Creating the Regular HTML and Making it Responsive
Before diving into the WebGL and Three.js implementation, we first need to create the HTML structure that we’ll later
mimic in the 3D world. I’ve set up a very simple page with some quick responsive content — you can find the setup content
in the demo repository under index.html
and styles.css
.
HTML
:
<div class="content">
  <div class="container">
    <section class="section__heading">
      <h3 data-animation="webgl-text" class="text__2">THREE.JS</h3>
      <h2 data-animation="webgl-text" class="text__1">
        RESPONSIVE AND ACCESSIBLE TEXT
      </h2>
    </section>
    <section class="section__main__content">
      <p data-animation="webgl-text" class="text__2">
        THIS TEXT IS STYLED TO LOOK LIKE A TYPICAL BLOCK OF TEXT ON A STANDARD
        WEBSITE. BUT UNDER THE SURFACE, IT'S BEING RENDERED WITH WEBGL INSTEAD
        OF TRADITIONAL HTML.
      </p>
      <p data-animation="webgl-text" class="text__2">
        THIS OPENS THE DOOR TO CUSTOM SHADER EFFECTS AND INTERACTIONS THAT GO
        BEYOND WHAT'S POSSIBLE WITH TRADITIONAL HTML.
      </p>
      <p data-animation="webgl-text" class="text__2">
        WE KEEP THE UNDERYLING HTML STRUCTURE PRESENT IN THE DOM. RATHER THAN
        CREATING MESHES DIRECTLY IN THREE.JS, THE SCENE IS BUILT BY READING FROM
        THE EXISTING HTML CONTENT. THIS WAY, SCREEN READERS, SEARCH ENGINES, AND
        OTHER TOOLS CAN STILL INTERPRET THE PAGE AS EXPECTED.
      </p>
    </section>
    <section class="section__footer">
      <p data-animation="webgl-text" class="text__3">
        NOW GO CRAZY WITH THE SHADERS :)
      </p>
    </section>
  </div>
</div>
The <canvas>
element is set to cover the entire screen, fixed in place behind the main content. We want a full screen canvas
covering the entire screen behind our main content at all times.
All text elements intended for WebGL rendering are marked with data-animation=”webgl-text” for clarity and easy
selection when we begin scripting.
The purpose of this setup is to function as the “placeholder” that we can mimic in our 3D implementation. So, it’s
important to position and style your text at this stage
to ensure it matches the final sizing and positioning that you want to achieve. All text formatting properties like
font-size, letter-spacing, line-height etc. are the properties you want to focus on, because we’ll later read these
computed styles directly from the DOM during the WebGL phase. Color is optional here, as we can handle text coloring
later with shaders inside WebGL.
That’s it for the HTML and CSS setup! It’s all we need for the foundation to move onto our JavaScript and WebGL
implementation.
2. Initial 3D World Setup
Let’s move onto the JavaScript and WebGL implementation. I’ll be using TypeScript, but you can easily follow along
with vanilla JavaScript if you prefer. I’m assuming you’re already familiar with the basics of Three.js, so I’ll focus
on explaining the high-level setup rather than covering every detail.
Below is the starter TypeScript and Three.JS base that I’ll be using for this demo.
// main.ts

import Commons from "./classes/Commons";
import * as THREE from "three";

/**
 * Main entry-point.
 * Creates Commons and Scenes
 * Starts the update loop
 * Eventually creates Postprocessing and Texts.
  */
class App {
  private commons!: Commons;

  scene!: THREE.Scene;

  constructor() {
    document.addEventListener("DOMContentLoaded", async () => {
      await document.fonts.ready; // Important to wait for fonts to load when animating any texts.

      this.commons = Commons.getInstance();
      this.commons.init();

      this.createScene();

      this.addEventListeners();

      this.update();
    });
  }

  private createScene() {
    this.scene = new THREE.Scene();
  }

  /**
   * The main loop handler of the App
   * The update function to be called on each frame of the browser.
   * Calls update on all other parts of the app
   */
  private update() {
    this.commons.update();

    this.commons.renderer.render(this.scene, this.commons.camera);

    window.requestAnimationFrame(this.update.bind(this));
  }

  private addEventListeners() {
    window.addEventListener("resize", this.onResize.bind(this));
  }

  private onResize() {
    this.commons.onResize();
  }
}

export default new App();
// Commons.ts

import { PerspectiveCamera, WebGLRenderer, Clock } from "three";

import Lenis from "lenis";

export interface Screen {
  width: number;
  height: number;
  aspect: number;
}

export interface Sizes {
  screen: Screen;
  pixelRatio: number
}

/**
 * Singleton class for Common stuff.
 * Camera
 * Renderer
 * Lenis
 * Time
 */
export default class Commons {
  private constructor() {}

  private static instance: Commons;

  lenis!: Lenis;
  camera!: PerspectiveCamera;
  renderer!: WebGLRenderer;

  private time: Clock = new Clock();
  elapsedTime!: number;

  sizes: Sizes = {
    screen: {
      width: window.innerWidth,
      height: window.innerHeight,
      aspect: window.innerWidth / window.innerHeight,
    },
    pixelRatio: this.getPixelRatio(),
  };

  private distanceFromCamera: number = 1000;

  /**
   * Function to be called to either create Commons Singleton instance, or to return existing one.
   * TODO AFTER: Call instances init() function.
   * @returns Commons Singleton Instance.
   */
  static getInstance() {
    if (this.instance) return this.instance;

    this.instance = new Commons();
    return this.instance;
  }

  /**
   * Initializes all-things Commons. To be called after instance is set.
   */
  init() {
    this.createLenis();
    this.createCamera();
    this.createRenderer();
  }

  /**
   * Creating Lenis instance.
   * Sets autoRaf to true so we don't have to manually update Lenis on every frame.
   * Resets possible saved scroll position.
   */
  private createLenis() {
    this.lenis = new Lenis({ autoRaf: true, duration: 2 });
  }

  private createCamera() {
    this.camera = new PerspectiveCamera(
      70,
      this.sizes.screen.aspect,
      200,
      2000
    );
    this.camera.position.z = this.distanceFromCamera;
    this.camera.updateProjectionMatrix();
  }

  /**
   * createRenderer(): Creates the common WebGLRenderer to be used.
   */
  private createRenderer() {
    this.renderer = new WebGLRenderer({
      alpha: true, // Sets scene background to transparent, so our body background defines the background color
    });

    this.renderer.setSize(this.sizes.screen.width, this.sizes.screen.height);

    this.renderer.setPixelRatio(this.sizes.pixelRatio);

	  // Creating canvas element and appending to body element.
    document.body.appendChild(this.renderer.domElement);
  }

  /**
   * Single source of truth to get pixelRatio.
   */
  getPixelRatio() {
    return Math.min(window.devicePixelRatio, 2);
  }

  /**
   * Resize handler function is called from the entry-point (main.ts)
   * Updates the Common screen dimensions.
   * Updates the renderer.
   * Updates the camera.
   */
  onResize() {
    this.sizes.screen = {
      width: window.innerWidth,
      height: window.innerHeight,
      aspect: window.innerWidth / window.innerHeight,
    };
    this.sizes.pixelRatio = this.getPixelRatio();

    this.renderer.setSize(this.sizes.screen.width, this.sizes.screen.height);
    this.renderer.setPixelRatio(this.sizes.pixelRatio);

    this.onResizeCamera();
  }

  /**
   * Handler function that is called from onResize handler.
   * Updates the perspective camera with the new adjusted screen dimensions
   */
  private onResizeCamera() {
    this.camera.aspect = this.sizes.screen.aspect;
    this.camera.updateProjectionMatrix();
  }

  /**
   * Update function to be called from entry-point (main.ts)
   */
  update() {
    this.elapsedTime = this.time.getElapsedTime();
  }
}
A Note About Smooth Scroll
When syncing HTML and WebGL worlds, you should use a custom scroll
. This is because the native scroll in browsers updates the scroll position at irregular intervals and does not thus
guarantee frame-perfect updates with our requestAnimationFrame loop and our WebGL world, causing a jittery and unsynchronized movement
.
By integrating a custom scroll (Lenis in this case), we ensure our scroll updates perfectly match the frame updates of
our WebGL world.
Right now we are seeing an empty 3D world, continuously being rendered.
We’re only missing one thing to get something visible in our 3D world: the creation of the text elements. So let’s
move onto creating our WebGLText class next.
3. Creating WebGLText Class and Texts Meshes
For the creation of the text meshes, we’ll be using troika-three-text
library.
npm i troika-three-text
We’ll now create a reusable WebGLText
class
. This will handle turning each HTML element into a 3D text mesh, using Troika and our Three.js scene.
Here’s the basic setup:
// WebGLText.ts

import Commons from "./Commons";
import * as THREE from "three";

// @ts-ignore
import { Text } from "troika-three-text";

interface Props {
  scene: THREE.Scene;
  element: HTMLElement;
}

export default class WebGLText {
  commons: Commons;

  scene: THREE.Scene;
  element: HTMLElement;

  computedStyle: CSSStyleDeclaration;
  font!: string; // Path to our .ttf font file.
  bounds!: DOMRect;
  color!: THREE.Color;
  material!: THREE.ShaderMaterial;
  mesh!: Text;

  // We assign the correct font bard on our element's font weight from here
  weightToFontMap: Record<string, string> = {
    "900": "/fonts/Humane-Black.ttf",
    "800": "/fonts/Humane-ExtraBold.ttf",
    "700": "/fonts/Humane-Bold.ttf",
    "600": "/fonts/Humane-SemiBold.ttf",
    "500": "/fonts/Humane-Medium.ttf",
    "400": "/fonts/Humane-Regular.ttf",
    "300": "/fonts/Humane-Light.ttf",
    "200": "/fonts/Humane-ExtraLight.ttf",
    "100": "/fonts/Humane-Thin.ttf",
  };

  private y: number = 0; // Scroll-adjusted bounds.top

  private isVisible: boolean = false;

  constructor({ scene, element }: Props) {
    this.commons = Commons.getInstance();

    this.scene = scene;
    this.element = element;

    this.computedStyle = window.getComputedStyle(this.element); // Saving initial computed style.
  }
}
We have access to the Text class
from Troika, which allows us to create text meshes elements and apply styling to it using familiar properties like
fontSize, letterSpacing, and font. I’ll cover everything you need to style your text responsively in this tutorial,
but I implore you to take a look at the full documentation and its possibilities here
.
Troika doesn’t ship with TypeScript definitions out of the box, so if you’re using TS, you can quickly get around this
by creating a type declaration file in the root of your project. It’s not pretty, but it gets the job done while
keeping TypeScript happy.
Let’s start by creating new methods called createFont(), createColor() and createMesh().
createFont()
: Selects the appropriate .ttf file based on the DOM element’s font-weight. If a match isn’t found, we fall back to
the regular weight. Adjust the mapping to match your own font files and multiple font families if needed.
createColor()
: Converts the computed CSS color into a THREE.Color instance:
// WebGLText.ts

private createColor() {
    this.color = new THREE.Color(this.computedStyle.color);
}
createMesh():
Instantiates the text mesh and sets some basic properties. Copies the text’s inner text and sets it onto the mesh.
Adds the mesh to our Three.JS scene. We anchor the text from the left-center to match typical HTML layout
expectations.
// WebGLText.ts
private createMesh() {
  this.mesh = new Text();

  this.mesh.text = this.element.innerText; // Copying HTML content over to the mesh
  this.mesh.font = this.font;

  // Anchor the text to the left-center (instead of center-center)
  this.mesh.anchorX = "0%";
  this.mesh.anchorY = "50%";

  this.mesh.color = this.color;

  this.scene.add(this.mesh);
}
⚠️ When copying text contents over to the Mesh, avoid using innerHTML or textContent and use innerText instead as it
gives the most layout-accurate and consistent results.
setStaticValues
(): Let’s also create a baby setStaticValues() method which will set the critical properties of our text mesh based on
the computedStyle.
We sets values like font size based on computed CSS. We’ll expand this more as we sync more styles down the line.
We want to call all these methods in the constructor like this:
Finally, let’s update our App class (main.ts), and hook this all up by scanning for DOM elements with a
data-animation=”webgl-text” attribute — creating a WebGLText instance for each one:
// main.ts

texts!: Array<WebGLText>;

// ...

private createWebGLTexts() {
  const texts = document.querySelectorAll('[data-animation="webgl-text"]');

  if (texts) {
    this.texts = Array.from(texts).map((el) => {
      const newEl = new WebGLText({
        element: el as HTMLElement,
        scene: this.scene,
      });

      return newEl;
    });
  }
}
Make sure to call this method in the constructor on initialization. This will populate our scene with styled text
meshes based on our DOM content.
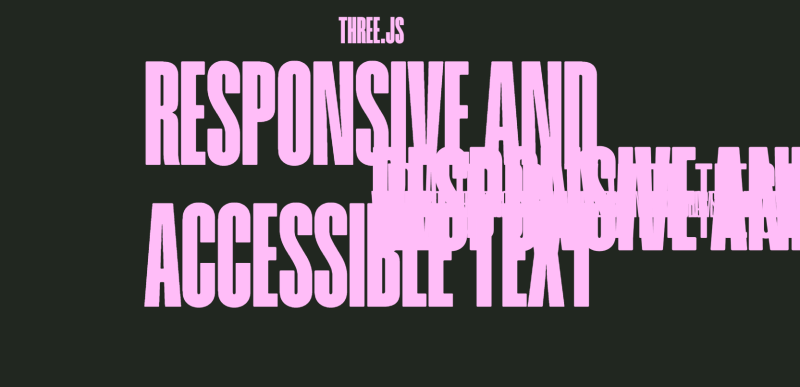
That’s all we need to have our text meshes visible, it’s not the prettiest sight to behold, but at least we got
everything working:
Next Challenge: Screen vs. 3D Space Mismatch
Even though we copy the font size directly from the DOM, the scale looks different in 3D. That’s because WebGL units don’t map 1:1 with screen pixels
, and they operate in different coordinate systems. This mismatch will become even more obvious if we start
positioning and animating elements.
To get true visual parity between our DOM elements and WebGL text, we need to bridge the gap between screen space and
3D space. Let’s tackle that next so our text sizes and positions actually match with what we see in the browser.
4. Syncing Dimensions
The major problem when syncing HTML and WebGL dimensions is that things between them aren’t exactly pixel-perfect.
This is because the DOM and WebGL don’t “speak the same units” by default.
Web browsers work in screen pixels.
WebGL uses arbitrary units
Our goal is simple:
💡 Make one unit in the WebGL scene equal one pixel on the screen.
To achieve this, we’ll adjust the camera’s field of view (FOV) so that visible area through the camera exactly matches
the dimensions of the browser window in pixels.
So, we’ll create a syncDimensions()
function under our Commons class, which calculates our camera’s field of view such that 1 unit in the WebGL scene
corresponds to 1 pixel on the screen — at a given distance from the camera.
 // Commons.ts
/**
  * Helper function that is called upon creation and resize
  * Updates the camera's fov according to the new dimensions such that the window's pixels match with that of WebGL scene
  */
private syncDimensions() {
  this.camera.fov =
    2 *
    Math.atan(this.sizes.screen.height / 2 / this.distanceFromCamera) *
    (180 / Math.PI);
}
This function will be called once when we create the camera, and every time that the screen is resized.
Let’s break down what’s actually going on here using the image below:
We know:
The height of the screen
The distance from camera (Z)
The FOV of the camera is the vertical angle (fov y in the image)
So our main goal is to set how wide (vertical angle) we see according to our screen height.
Because the Z (distance from camera) and half of the screen height forms a right triangle
(distance + height), we can solve for the angle using some basic trigonometry, and compute the FOV using the inverse
tangent ( atan
) of this triangle.
Step-by-step Breakdown of the Formula
this.sizes.screen.height / 2
→ This gives us half the screen’s pixel height — the opposite side of our triangle.
this.distanceFromCamera
→ This is the adjacent side of the triangle — the distance from the camera to the 3D scene.
Math.atan(opposite / adjacent)
→ Calculates half of the vertical FOV (in radians).
*2
→ Since atan only gives half of the angle, we multiply it by 2 to get the full FOV.
* (180 / Math.PI)
→ Converts the angle from radians to degrees (Three.js expects degrees for PerspectiveCamera’s fov)
That’s all we need to sync our dimensions, and this setup ensures that 1 unit in WebGL = 1 pixel on screen.
Let’s move back to the text implementation.
5. Setting Text Properties and Positioning
Now that we’ve synced the WebGL scene to our screen’s pixel dimensions, we can start mapping HTML styles to our 3D
text.
If everything’s wired up correctly, you should see that the font size of the WebGL-rendered text matches the size of
the underlying HTML, although the positioning is still off.
Let’s sync more styling properties and positioning.
Before we can position the 3D text, we need to get the DOM element’s position and size. We’ll create a new method in
the WebGLText class called createBounds() ,
and use the browser’s built-in getBoundingClientRect() method:
Next, we’ll pull important typographic properties from the DOM (computed style) and pass them to the 3D mesh, so that
it behaves like our native HTML text. (Again, you can see the full documentation and possible properties of troika here
). Below I’ve included the most important ones.
  // WebGLText.ts

private setStaticValues() {
  const { fontSize, letterSpacing, lineHeight, whiteSpace, textAlign } =
    this.computedStyle;

  const fontSizeNum = window.parseFloat(fontSize);

  this.mesh.fontSize = fontSizeNum;

  this.mesh.textAlign = textAlign;

  // Troika defines letter spacing in em's, so we convert to them
  this.mesh.letterSpacing = parseFloat(letterSpacing) / fontSizeNum;

  // Same with line height
  this.mesh.lineHeight = parseFloat(lineHeight) / fontSizeNum;

  // Important to define maxWidth for the mesh, so that our text doesn't overflow
  this.mesh.maxWidth = this.bounds.width;

  // Match whiteSpace behavior (e.g., 'pre', 'nowrap')
  this.mesh.whiteSpace = whiteSpace;
}
Troika accepts some of the properties in local em units, so we have to convert pixels into em’s by dividing the pixel
values by the font size.
Also, it’s important to set a maximum width (in pixels) to constrain the mesh’s layout — this prevents text from
overflowing and ensures proper text wrapping.
And finally, let’s create an update()
function to be called on each frame that consistently positions our mesh according to the underlying DOM position.
And now, the texts will perfectly follow DOM counterparts
, even as the user scrolls.
Let’s finalize our base text class implementation before diving into effects:
Resizing
We need to ensure that our WebGL text updates correctly on window resize events. This means recreating the computedStyle, bounds, and static values
whenever the window size changes.
Once everything is working responsively and perfectly synced with the DOM, we can finally hide the original HTML text by setting it transparent
— but we’ll keep it in place so it’s still selectable and accessible to the user.
// WebGLText.ts

this.createFont();
this.createColor();
this.createBounds();
this.createMesh();
this.setStaticValues();

this.element.style.color = "transparent"; // Hide DOM element
We should now have our perfectly responsive text meshes, and the user only sees the rendered WebGL text, while the DOM
element remains fully intact for accessibility.
Let’s add some effects!
6. Adding a Custom shader and Replicating Mask Reveal Animations
Troika also lets us use custom shader materials for meshes, giving us the flexibility to create complex effects beyond
just setting colors.
The vertex shader passes the texture coordinates (uv) to the fragment shader for the text rendering.
Shader File Imports using Vite
To handle shader files more easily, we can use the vite-plugin-glsl
plugin together with Vite to directly import shader files like .frag and .vert in code:
Let’s now create our custom ShaderMaterial and apply it to our mesh:
// WebGLText.ts

// Importing shaders
import fragmentShader from "../../shaders/text/text.frag";
import vertexShader from "../../shaders/text/text.vert";

//...

this.createFont();
this.createColor();
this.createBounds();
this.createMaterial(); // Creating material
this.createMesh();
this.setStaticValues();

//...

private createMaterial() {
   this.material = new THREE.ShaderMaterial({
     fragmentShader,
     vertexShader
       uniforms: {
       uColor: new THREE.Uniform(this.color), // Passing our color to the shader
     },
   });
 }
In the createMaterial()
method, we define the ShaderMaterial
using the imported shaders and pass in the uColor uniform, which allows us to dynamically control the color of the
text based on our DOM-element.
And now, instead of setting the color directly on the default mesh material, we apply our new custom material:
  // WebGLText.ts

private createMesh() {
  this.mesh = new Text();

  this.mesh.text = this.element.innerText; // Always use innerText (not innerHTML or textContent).
  this.mesh.font = this.font;

  this.mesh.anchorX = "0%";
  this.mesh.anchorY = "50%";

  this.mesh.material = this.material; //Using custom material instead of color
}
At this point, we are using our custom shader material, but so far, nothing in our output has changed. Let’s now setup
show and hide animations using our custom shader, and replicate the mask reveal effect.
Setting up Reveal Animations
We’ll create an animation that uses a progress uniform (uProgress) to control the visibility and reveal progress of
the text. The animation will be controlled using the motion library.
First, we must install motion
and import its animate
and inView
functions to our WebGLText class.
npm i motion
// WebGLText.ts

import { inView, animate } from "motion";
Now, let’s configure our class so that when the text steps into view, the show() function is called
, and when it steps away, the hide() function is called
. These methods also control the current visibility variable this.isVisible
. These functions will control the uProgress variable, and animate it between 0 and 1.
For this, we also must setup an addEventListeners() function:
 // WebGLText.ts

/**
  * Inits visibility tracking using motion's inView function.
  * Show is called when the element steps into view, and hide is called when the element steps out of view
  */
private addEventListeners() {
  inView(this.element, () => {
    this.show();

    return () => this.hide();
  });
}

show() {
  this.isVisible = true;

  animate(
    this.material.uniforms.uProgress,
    { value: 1 },
    { duration: 1.8, ease: [0.25, 1, 0.5, 1] }
  );
}

hide() {
  animate(
    this.material.uniforms.uProgress,
    { value: 0 },
    { duration: 1.8, onComplete: () => (this.isVisible = false) }
  );
}
Just make sure to call addEventListeners() in your constructor after setting up the class.
Updating the Shader Material for Animation
We’ll also add two additional uniform variables in our material for the animations:
uProgress
: Controls the reveal progress (from 0 to 1).
uHeight
: Used by the vertex shader to calculate vertical position offset.
Updated createMaterial()
method:
 // WebGLText.ts

private createMaterial() {
  this.material = new THREE.ShaderMaterial({
    fragmentShader,
    vertexShader,
    uniforms: {
      uProgress: new THREE.Uniform(0),
      uHeight: new THREE.Uniform(this.bounds.height),
      uColor: new THREE.Uniform(this.color),
    },
  });
}
Since the uHeight is dependent on bounds, we also want to update the uniform variable upon resizing:
We now have the text class instance automatically calling show() and hide(), and animating the uProgress according to
the visibility of our underlying DOM-element.
For performance, you might want to update the update() method to only calculate a new position when the mesh is
visible:
Creating a mask reveal effect with custom shaders in WebGL is surprisingly simple when we break it down into two
separate movements: one happening in the fragment shader and the other in the vertex shader. You might’ve seen this
effect happen in WebGL on the page of Zajno
, for example.
Instead of overcomplicating the concept with complex masks or thinking about “lifting it up” behind a window (as we do
in traditional HTML), we can think of it as two distinct actions that work together.
Fragment Shader
: We clip the text vertically, revealing it gradually from top to bottom.
Vertex Shader
: We translate the text’s position from the bottom to the top by its height.
Together these two movements create the illusion of the text lifting itself up from behind a mask.
Let’s update our fragment shader code:
//text.frag

uniform float uProgress; // Our progress value between 0 and 1

uniform vec3 uColor;
varying vec2 vUv;

void main() {
  // Calculate the reveal threshold (bottom to top reveal)
  float reveal = 1.0 - vUv.y;

  // Discard fragments above the reveal threshold based on progress
  if (reveal > uProgress) discard;

  // Apply the color to the visible parts of the text
  gl_FragColor = vec4(uColor, 1.0);
}
When uProgress is 0, the mesh is fully clipped out, and nothing is visible
When uProgress increases towards 1, the mesh reveals itself from top to bottom.
For the vertex shader, we can simply pass the new uniform called uHeight, which stands for the height of our
DOM-element (this.bounds.height), and translate the output vertically according to it and uProgress.
//text.vert

uniform float uProgress;
uniform float uHeight; // Total height of the mesh passed in from JS

varying vec2 vUv;

void main() {
  vUv = uv;

  vec3 transformedPosition = position;

  // Push the mesh upward as it reveals
  transformedPosition.y -= uHeight * (1.0 - uProgress);

  gl_Position = projectionMatrix * modelViewMatrix * vec4(transformedPosition, 1.0);
}
uHeight
: Total height of the DOM-element (and mesh), passed in from JS.
When uProgress
is 0
, the mesh is fully pushed down.
As uProgress
reaches 1
, it resolves to its natural position.
Now, we should have a beautifully on-scroll animating scene, where the texts reveal themselves as in regular HTML when
they scroll into view.
To spice things up, let’s add some scroll-velocity based post processing effects to our scene as the final step!
7. Adding Post-processing
Now that we’ve built our animated WebGL text with custom shaders and scroll-triggered reveals, we can push the visuals
further with post-processing
.
Post-processing allows us to apply full-screen visual effects after the scene has been rendered. This is done by
passing the final image through a series of custom shader passes.
So, in this final section, we’ll:
Set up a PostProcessing class using Three.js’s EffectComposer
Add a custom RGB shift and wave distortion effect
Drive the distortion strength dynamically using the scroll velocity from our Lenis custom scroll instance
Creating a PostProcessing class with EffectComposer
Let’s create a PostProcessing class that will be intialized from our entry-point, and which will handle everything
regarding postprocessing using Three.JS’s EffectComposer. Read more about the EffectComposer class here from Three.js’s documentation
. We’ll also create new fragment and vertex shaders for the postprocessing class to use.
// PostProcessing.ts

import {
  EffectComposer,
  RenderPass,
  ShaderPass,
} from "three/examples/jsm/Addons.js";
import Commons from "./Commons";
import * as THREE from "three";

// Importing postprocessing shaders
import fragmentShader from "../../shaders/postprocessing/postprocessing.frag";
import vertexShader from "../../shaders/postprocessing/postprocessing.vert";

interface Props {
  scene: THREE.Scene;
}

export default class PostProcessing {
  // Scene and utility references
  private commons: Commons;
  private scene: THREE.Scene;

  private composer!: EffectComposer;

  private renderPass!: RenderPass;
  private shiftPass!: ShaderPass;

  constructor({ scene }: Props) {
    this.commons = Commons.getInstance();

    this.scene = scene;

    this.createComposer();
    this.createPasses();
  }

  private createComposer() {
    this.composer = new EffectComposer(this.commons.renderer);
    this.composer.setPixelRatio(this.commons.sizes.pixelRatio);
    this.composer.setSize(
      this.commons.sizes.screen.width,
      this.commons.sizes.screen.height
    );
  }

  private createPasses() {
    // Creating Render Pass (final output) first.
    this.renderPass = new RenderPass(this.scene, this.commons.camera);
    this.composer.addPass(this.renderPass);

    // Creating Post-processing shader for wave and RGB-shift effect.
    const shiftShader = {
      uniforms: {
        tDiffuse: { value: null },      // Default input from previous pass
        uVelocity: { value: 0 },        // Scroll velocity input
        uTime: { value: 0 },            // Elapsed time for animated distortion
      },
      vertexShader,
      fragmentShader,
    };

    this.shiftPass = new ShaderPass(shiftShader);
    this.composer.addPass(this.shiftPass);
  }

  /**
   * Resize handler for EffectComposer, called from entry-point.
   */
  onResize() {
    this.composer.setPixelRatio(this.commons.sizes.pixelRatio);
    this.composer.setSize(
      this.commons.sizes.screen.width,
      this.commons.sizes.screen.height
    );
  }

  update() {
    this.shiftPass.uniforms.uTime.value = this.commons.elapsedTime;

    this.composer.render();
  }
}
Since we don’t have our postprocessing shaders created yet, make sure you create placeholder postprocessing.frag and
postprocessing.vert shaders so the imports don’t fail.
Constructor:
Initializes the class by storing the provided scene, grabbing the shared Commons instance, and then calling createComposer()
and createPasses()
.
createComposer():
Sets up the EffectComposer with the correct pixel ratio and canvas size:
EffectComposer wraps the WebGL renderer and allows chaining of multiple render passes.
Sized according to current viewport dimensions and pixel ratio
createPasses():
This method sets up all rendering passes applied to the scene.
RenderPass
: The first pass that simply renders the scene with the main camera as regular.
ShaderPass (shiftPass)
: A custom full-screen shader pass that we’ll create and which will create the RGB shift and wavy distortion
effects.
update():
Method called on every frame. Updates the uTime uniform so we can animate effects over time, and renders the final
post-processed image using composer.render()
Initializing Post-processing
To wire the post-processing system into our existing app, we update our main.ts:
  //main.ts
private postProcessing!: PostProcessing;

//....

constructor() {
  document.addEventListener("DOMContentLoaded", async () => {
    await document.fonts.ready;

    this.commons = Commons.getInstance();
    this.commons.init();

    this.createScene();
    this.createWebGLTexts();
    this.createPostProcessing(); // Creating post-processing
    this.addEventListeners();

    this.update();
  });
}

// ...

private createPostProcessing() {
  this.postProcessing = new PostProcessing({ scene: this.scene });
}

// ...

private update() {
  this.commons.update();

  if (this.texts) {
    this.texts.forEach((el) => el.update());
  }

  // Don't need line below as we're rendering everything using EffectComposer.
  // this.commons.renderer.render(this.scene, this.commons.camera);

  this.postProcessing.update(); // Post-processing class handles rendering of output from now on


  window.requestAnimationFrame(this.update.bind(this));
}


private onResize() {
  this.commons.onResize();

  if (this.texts) {
    this.texts.forEach((el) => el.onResize());
  }

  this.postProcessing.onResize(); // Resize post-processing
}
So in the new update() function, instead of rendering directly from there, we now hand off rendering responsibility to
the PostProcessing class.
Creating Post-processing Shader and Wiring Scroll Velocity
We want to modify the PostProcessing class further, so that we update the postprocessing fragment shader with the
current scroll velocity from Lenis.
For this, I’m adding a new property lerpedVelocity and lerpFactor, which control the smoothed out velocity. The raw
velocity values from lenis can be spiky and sudden, especially with fast scrolling or scroll jumps. If we pass that
raw value directly into a shader, it can cause a really jittery output.
private lerpedVelocity = 0; // Smoothed scroll velocity for post-processing.
private lerpFactor = 0.05; // Controls how quickly lerpedVelocity follows the real velocity

// ...

update() {
    this.shiftPass.uniforms.uTime.value = this.commons.elapsedTime;

  // Reading current velocity form lenis instance.
  const targetVelocity = this.commons.lenis.velocity;

  // We use the lerped velocity as the actual velocity for the shader, just for a smoother experience.
  this.lerpedVelocity +=
    (targetVelocity - this.lerpedVelocity) * this.lerpFactor;

  this.shiftPass.uniforms.uVelocity.value = this.lerpedVelocity;

  this.composer.render();
}
Post-processing Shaders
For the vertex shader, we can keep all things default, we pass the texture coordinates to the fragment shader.
The red channel is offset slightly based on the velocity, creating the RGB shift effect.
// Applying the RGB shift to the wave-distorted coordinates
float r = texture2D(tDiffuse, vec2(waveUv.x, waveUv.y + uVelocity * 0.0005)).r;
vec2 gb = texture2D(tDiffuse, waveUv).gb;

gl_FragColor = vec4(r, gb, r);
This will create a subtle color separation in the final image that shifts according to our scroll velocity.
Finally, we combine red, green, blue, and alpha into the output color.
8. Final Result
And there you have it! We’ve created a responsive text scene, with scroll-triggered mask reveal animations and
wavy/rgb shifted post-processing.
This setup provides a solid, modular foundation for building more advanced WebGL text effects. If you’re curious to explore further, consider adding particles, fluid simulations, audio reactivity, or more complex materials and shaders. If you’re interested in breakdowns of any of these, feel free to reach out on X.
A simple way to improve efficiency is knowing your IDE shortcuts. Let’s learn how to create custom ones to generate code automatically.
Table of Contents
Just a second! 🫷 If you are here, it means that you are a software developer.
So, you know that storage, networking, and domain management have a cost .
If you want to support this blog, please ensure that you have disabled the adblocker for this site. I configured Google AdSense to show as few ADS as possible – I don’t want to bother you with lots of ads, but I still need to add some to pay for the resources for my site.
Thank you for your understanding. – Davide
One of the best tricks to boost productivity is knowing your tools.
I’m pretty sure you’ve already used some predefined snippets in Visual Studio. For example, when you type ctor and hit Tab twice, VS automatically creates an empty constructor for the current class.
In this article, we will learn how to create custom snippets: in particular, we will design a snippet that automatically creates a C# Unit Test method with some placeholders and predefined Arrange-Act-Assert blocks.
Snippet Designer: a Visual Studio 2022 extension to add a UI to your placeholders
Snippets are defined in XML-like files with .snippet extension. But we all know that working with XMLs can be cumbersome, especially if you don’t have a clear idea of the expected structure.
Therefore, even if not strictly necessary, I suggest installing a VS2022 extension called Snippet Designer 2022.
This extension, developed by Matthew Manela, can be found on GitHub, where you can view the source code.
This extension gives you a UI to customize the snippet instead of manually editing the XML nodes. It allows you to customize the snippet, the related metadata, and even the placeholders.
Create a basic snippet in VS2022 using a .snippet file
As we saw, snippets are defined in a simple XML.
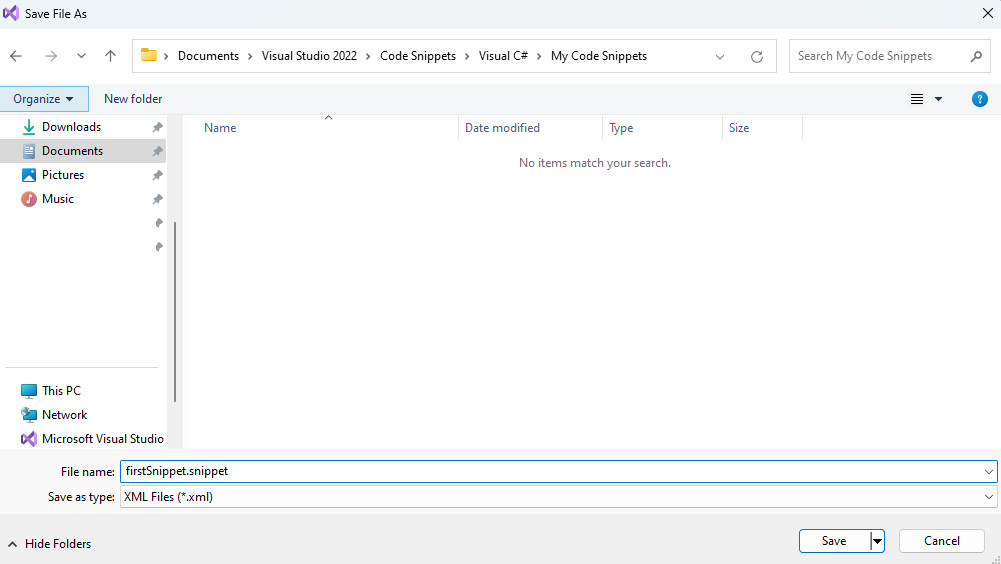
In order to have your snippets immediately available in Visual Studio, I suggest you create those files in a specific VS2022 folder under the path \Documents\Visual Studio 2022\Code Snippets\Visual C#\My Code Snippets\.
So, create an empty file, change its extension to .snippet, and save it to that location.
Now, you can open Visual Studio (it’s not necessary to open a project, but I’d recommend you to do so). Then, head to File > Open, and open the file you saved under the My Code Snippets directory.
Thanks to Snippet Designer, you will be able to see a nice UI instead of plain XML content.
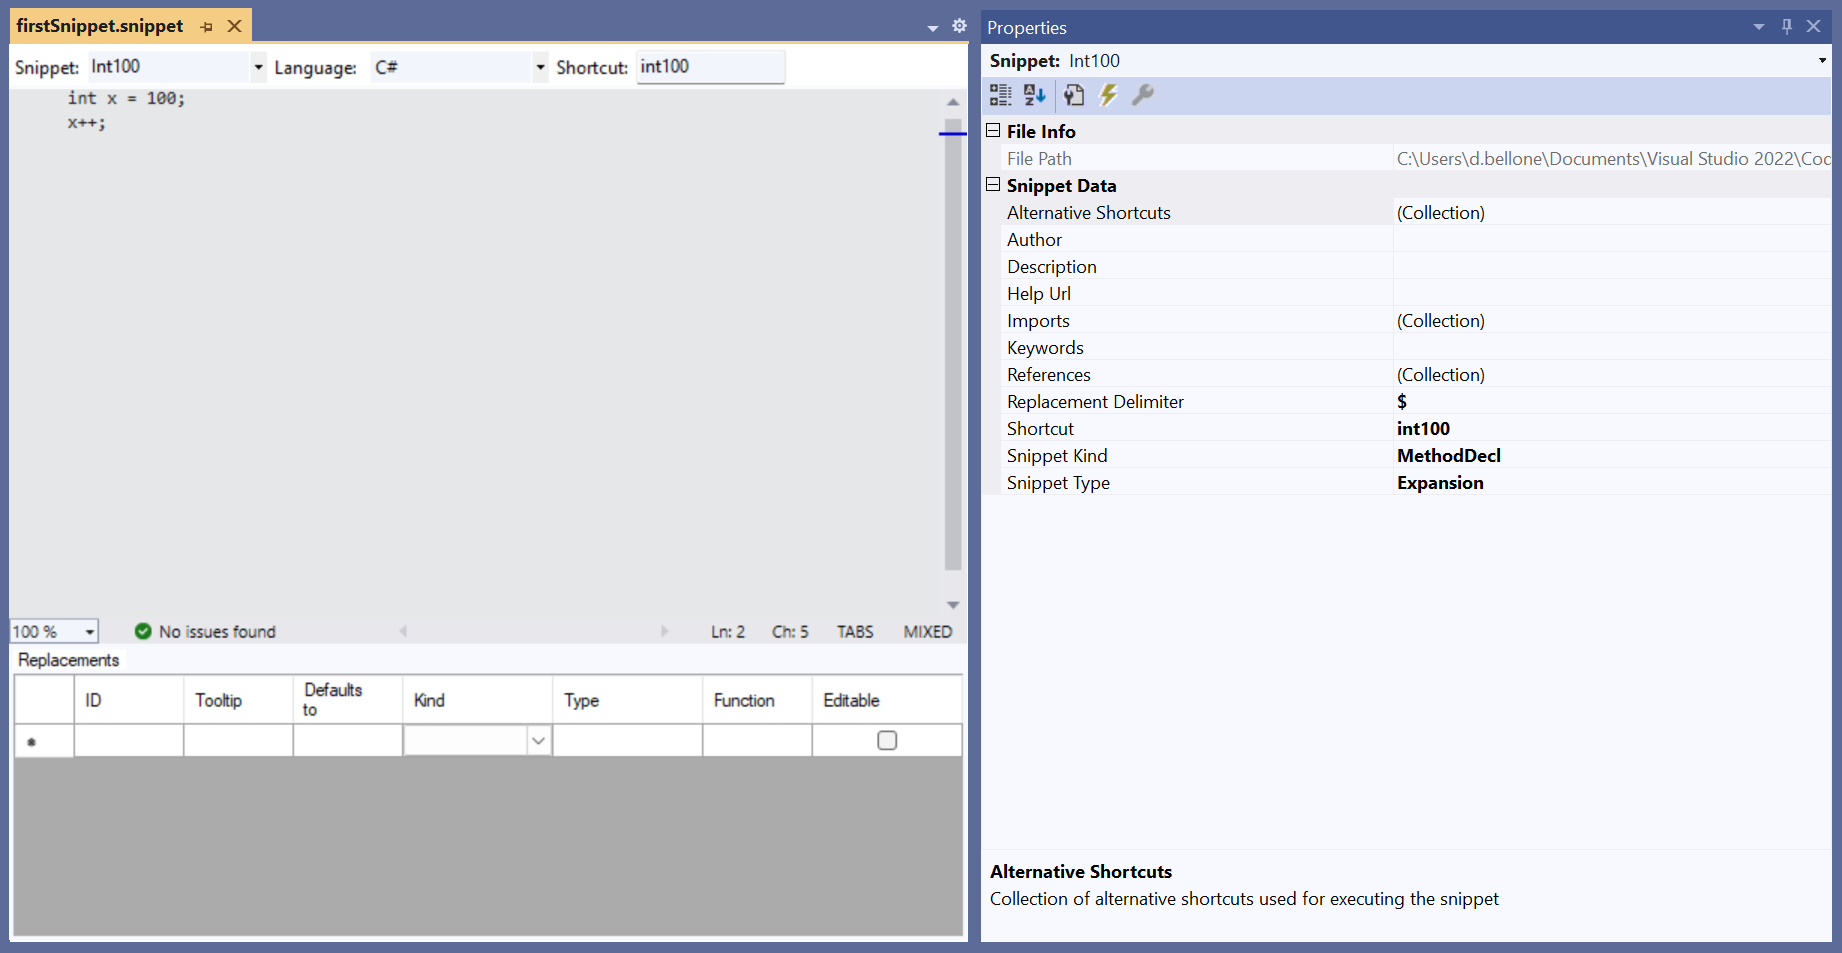
Have a look at how I filled in the several parts to create a snippet that generates a variable named x, assigns to it a value, and then calls x++;
Have a look at the main parts:
the body, which contains the snippet to be generated;
the top layer, where we specified:
the Snippet name: Int100; it’s the display name of the shortcut
the code language: C#;
the shortcut: int100; it’s the string you’ll type in that allows you to generate the expected snippet;
the bottom table, which contains the placeholders used in the snippet; more on this later;
the properties tab, on the sidebar: here is where you specify some additional metadata, such as:
Author, Description, and Help Url of the snippet, in case you want to export it;
the kind of snippet: possible values are MethodBody, MethodDecl and TypeDecl. However, this value is supported only in Visual Basic.
Now, hit save and be ready to import it!
Just for completeness, here’s the resulting XML:
<?xml version="1.0" encoding="utf-8"?><CodeSnippetsxmlns="http://schemas.microsoft.com/VisualStudio/2005/CodeSnippet"><CodeSnippetFormat="1.0.0"><Header><SnippetTypes><SnippetType>Expansion</SnippetType></SnippetTypes><Title>Int100</Title><Author></Author><Description></Description><HelpUrl></HelpUrl><Shortcut>int100</Shortcut></Header><Snippet><CodeKind="method decl"Language="csharp"Delimiter="$"><![CDATA[int x = 100;
x++;]]></Code></Snippet></CodeSnippet></CodeSnippets>
Notice that the actual content of the snippet is defined in the CDATA block.
Import the snippet in Visual Studio
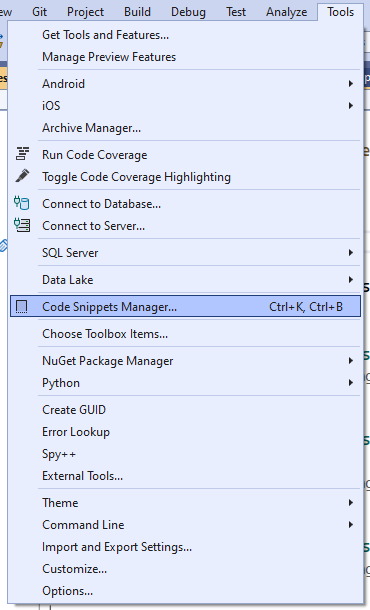
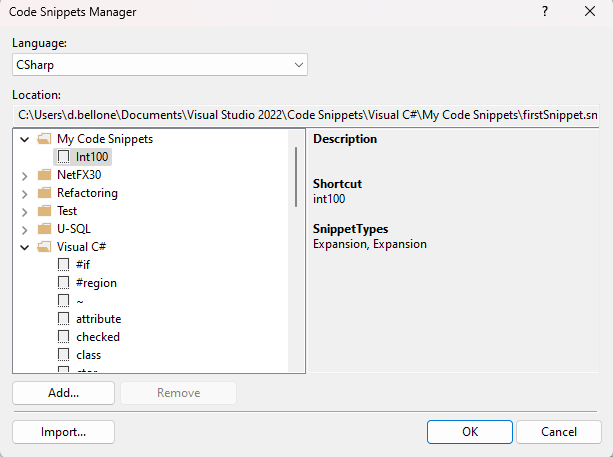
It’s time to import the snippet. Open the Tools menu item and click on Code Snippets Manager.
From here, you can import a snippet by clicking the Import… button. Given that we’ve already saved our snippet in the correct folder, we’ll find it under the My Code Snippets folder.
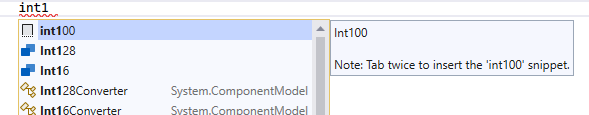
Now it’s ready! Open a C# class, and start typing int100. You’ll see our snippet in the autocomplete list.
By hitting Tab twice, you’ll see the snippet’s content being generated.
How to use placeholders when defining snippets in Visual Studio
Wouldn’t it be nice to have the possibility to define customizable parts of your snippets?
Let’s see a real example: I want to create a snippet to create the structure of a Unit Tests method with these characteristics:
it already contains the AAA (Arrange, Act, Assert) sections;
the method name should follow the pattern “SOMETHING should DO STUFF when CONDITION”. I want to be able to replace the different parts of the method name by using placeholders.
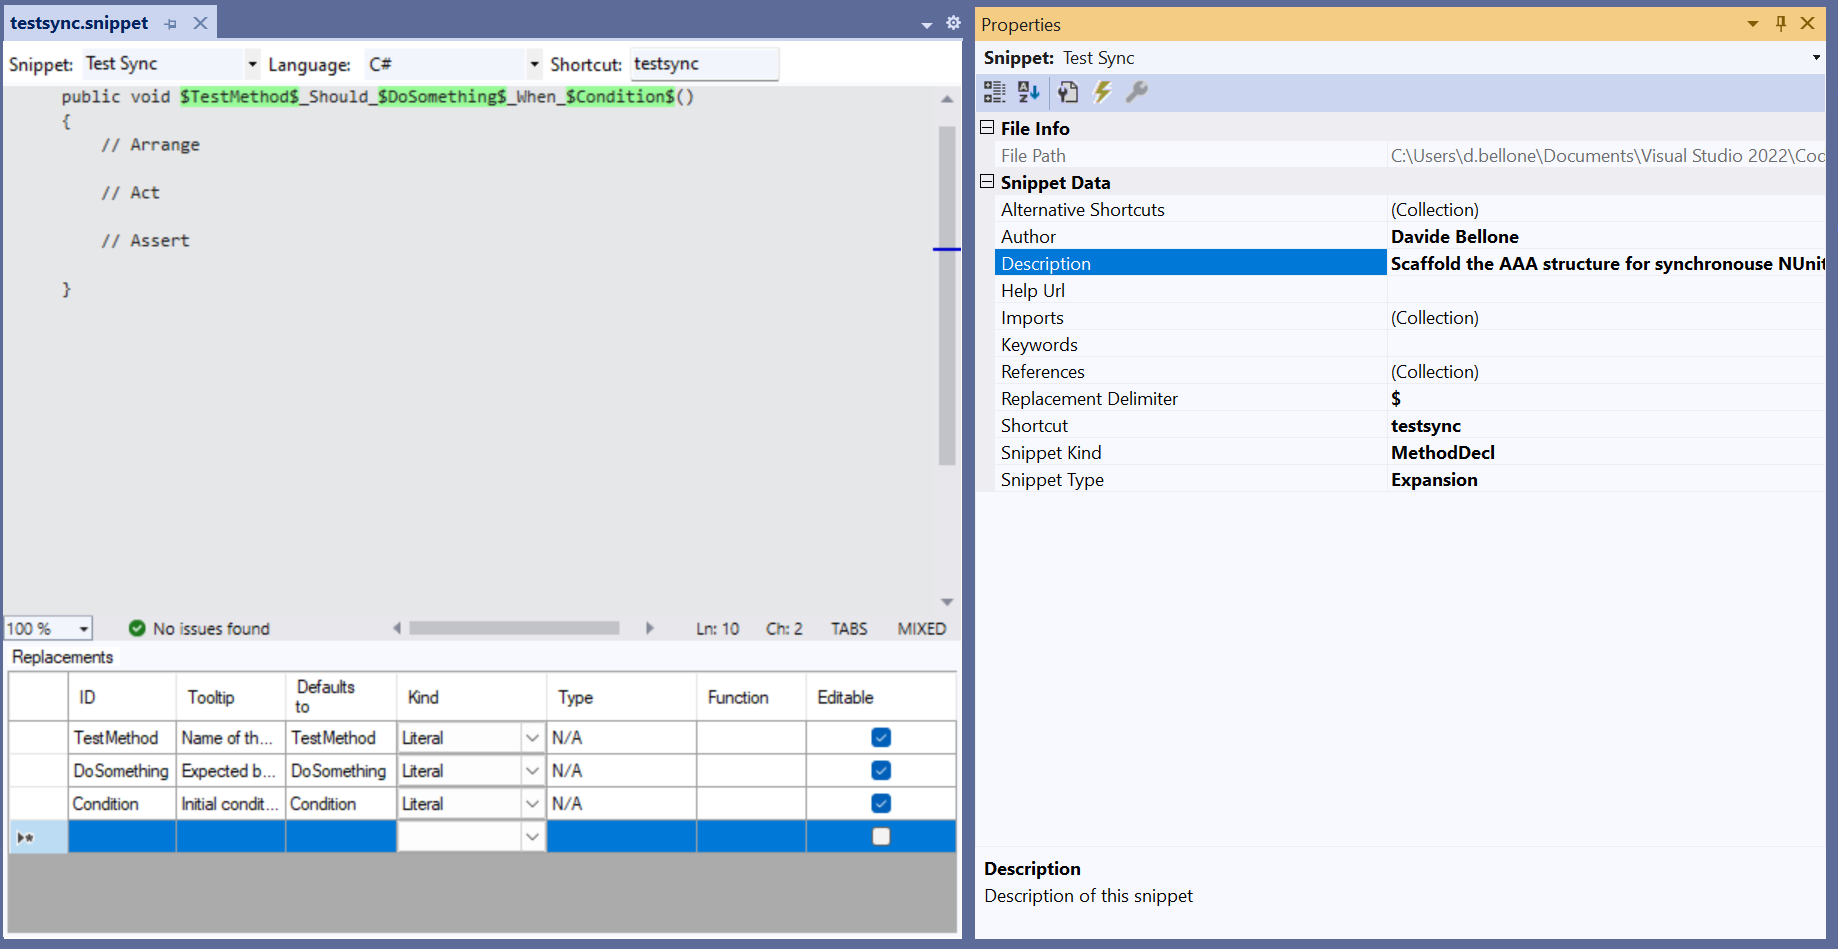
You can define placeholders using the $ symbol. You will then see the placeholders in the table at the bottom of the UI. In this example, the placeholders are $TestMethod$, $DoSomething$, and $Condition$. I also added a description to explain the purpose of each placeholder better.
The XML looks like this:
<?xml version="1.0" encoding="utf-8"?><CodeSnippetsxmlns="http://schemas.microsoft.com/VisualStudio/2005/CodeSnippet"><CodeSnippetFormat="1.0.0"><Header><SnippetTypes><SnippetType>Expansion</SnippetType></SnippetTypes><Title>Test Sync</Title><Author>Davide Bellone</Author><Description>Scaffold the AAA structure for synchronous NUnit tests</Description><HelpUrl></HelpUrl><Shortcut>testsync</Shortcut></Header><Snippet><Declarations><LiteralEditable="true"><ID>TestMethod</ID><ToolTip>Name of the method to be tested</ToolTip><Default>TestMethod</Default><Function></Function></Literal><LiteralEditable="true"><ID>DoSomething</ID><ToolTip>Expected behavior or result</ToolTip><Default>DoSomething</Default><Function></Function></Literal><LiteralEditable="true"><ID>Condition</ID><ToolTip>Initial conditions</ToolTip><Default>Condition</Default><Function></Function></Literal></Declarations><CodeLanguage="csharp"Delimiter="$"Kind="method decl"><![CDATA[[Test]
public void $TestMethod$_Should_$DoSomething$_When_$Condition$()
{
// Arrange
// Act
// Assert
}]]></Code></Snippet></CodeSnippet></CodeSnippets>
Now, import it as we already did before.
Then, head to your code, start typing testsync, and you’ll see the snippet come to life. The placeholders we defined are highlighted. You can then fill in these placeholders, hit tab, and move to the next one.
Bonus: how to view all the snippets defined in VS
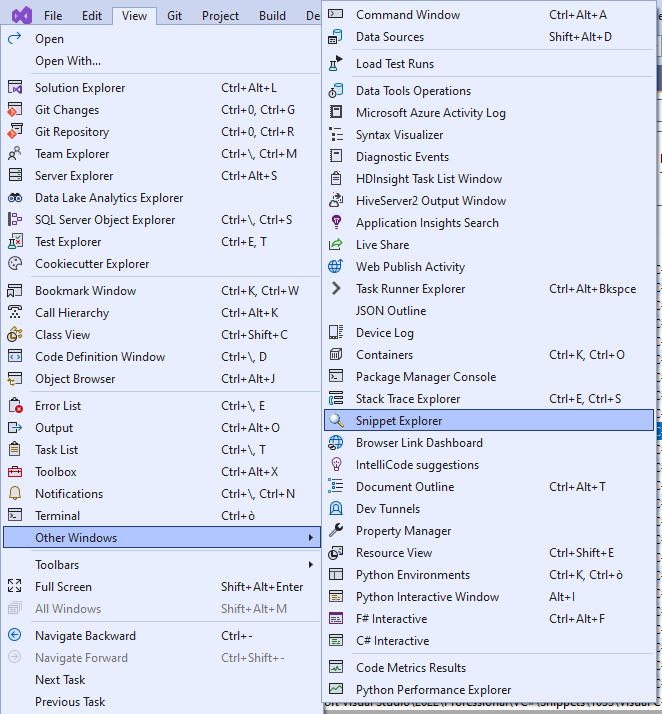
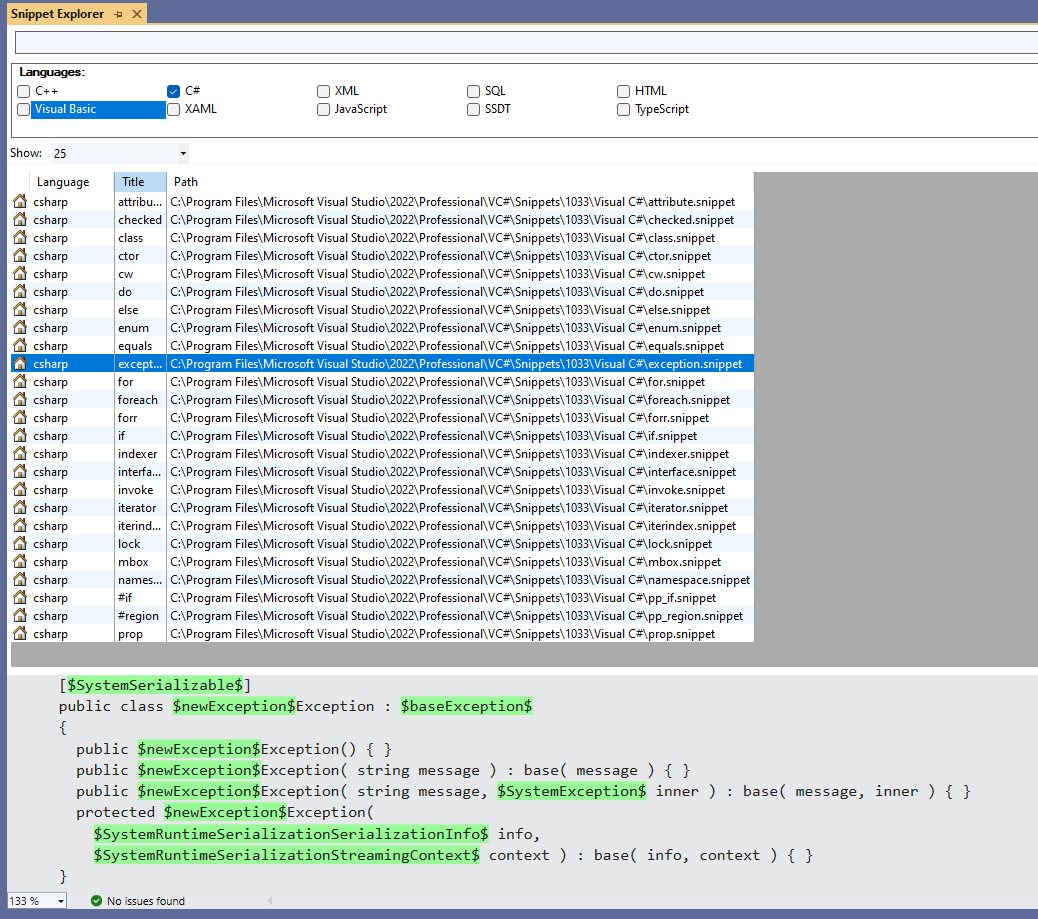
If you want to learn more about your IDE and the available snippets, you can have a look at the Snippet Explorer table.
You can find it under View > Tools > Snippet Explorer.
Here, you can see all the snippets, their shortcuts, and the content of each snippet. You can also see the placeholders highlighted in green.
It’s always an excellent place to learn more about Visual Studio.
Further readings
As always, you can read more on Microsoft Docs. It’s a valuable resource, although I find it difficult to follow.
There are some tips that may improve both the code quality and the developer productivity.
If you want to enforce some structures or rules, add such snippets in your repository; when somebody joins your team, teach them how to import those snippets.
I hope you enjoyed this article! Let’s keep in touch on Twitter or LinkedIn! 🤜🤛
The quality of a project can be measured by having a look at how the code is written. SonarQube can help you by running static code analysis and letting you spot the pain points. Let’s learn how to install and run it locally with Docker.
Table of Contents
Just a second! 🫷 If you are here, it means that you are a software developer.
So, you know that storage, networking, and domain management have a cost .
If you want to support this blog, please ensure that you have disabled the adblocker for this site. I configured Google AdSense to show as few ADS as possible – I don’t want to bother you with lots of ads, but I still need to add some to pay for the resources for my site.
Thank you for your understanding. – Davide
Code quality is important, and having the right tool can be terribly beneficial for an application’s long-term success.
Although maintainability problems often come from module separation and cannot be solved by making a single class cleaner, a tool like SonarQube can pave the way to a cleaner codebase.
In this article, we will learn how to download and install SonarQube Community using Docker. We will see how to configure it and run your very first code analysis on a .NET-based application.
Scaffold a dummy ASP.NET Core API project
To try it out, you need- of course! – a repository to analyse.
In this article, I will set up SonarQube to analyse a tiny, dummy ASP.NET Core API project. You are probably already familiar with this API project: it’s the default one created by Visual Studio – the one with the Weather Forecast.
I chose to use Controllers instead of Minimal APIs so that we could analyse some more code.
Have a look at the code: you will notice that the default implementation of the WeatherForecastController injects an instance of ILogger, stores it, and then never references it in other places. This sounds like a good maintainability issue that SonarQube should be able to identify.
To better locate which files SonarQube is creating, I decided to put this project under source control, but only locally. This way, when we run the SonarQube analysis, we will be able to see the files created and modified by SonarQube.
Clearly, the first step is to have SonaQube installed on your machine.
I’m going to install SonarQube Community Build. It contains almost all the functionalities of SonarQube, and it’s available for free (of course, to have additional functionalities, you have to pick the proper pricing tier).
SonarQube Community Build can be installed via Docker: this way, SonarQube can run in a containerised environment, regardless of your Operating System.
To do that, you can run the following command:
docker run --name sonarqube-community -p 9001:9000 sonarqube:community
This Docker command downloads the latest version of the sonarqube:community Docker Image, and runs it locally, making it available at localhost:9001.
As briefly explained in an old article, the -p 9001:9000 part of the CLI command means that you are exposing the port 9000 of the “inner” container to the world via the port 9001 of the host.
Once the command has finished downloading all the dependencies and loading all the resources, you will be able to access SonarQube on localhost:9001.
You will be asked to log in: the default username is admin, and the password is (again) admin.
After the first login, you will be asked to change your password.
Create a SonarQube Project
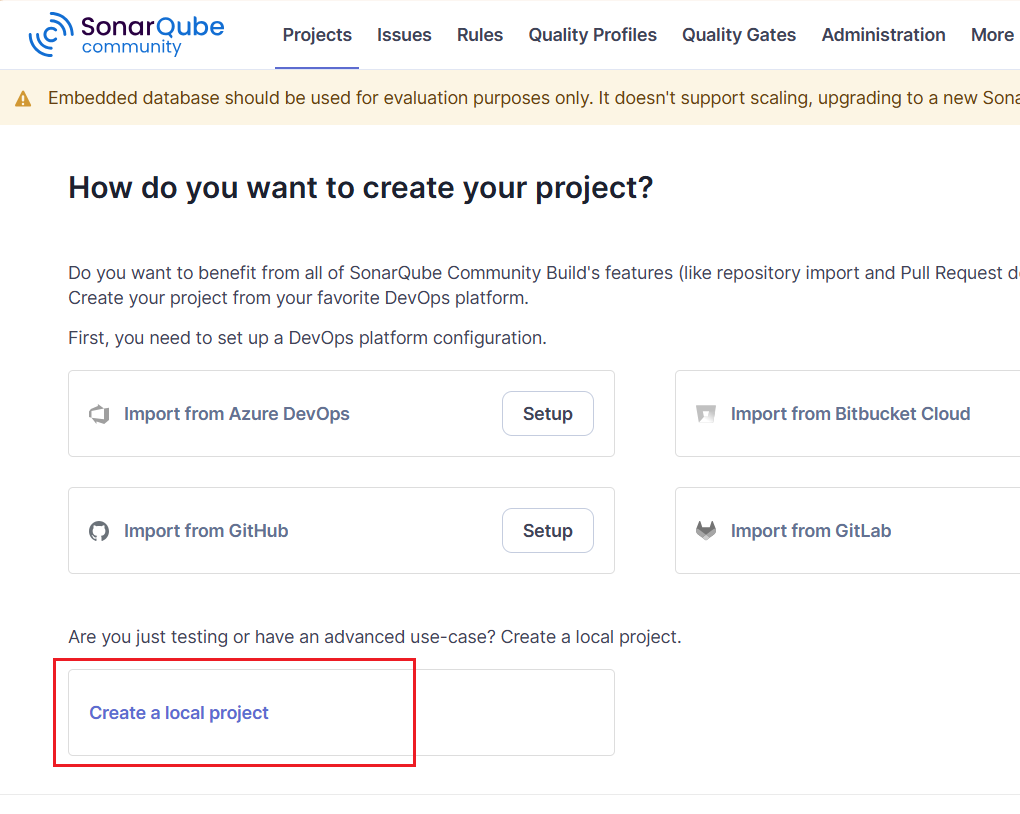
It’s time to link SonarQube to your repository.
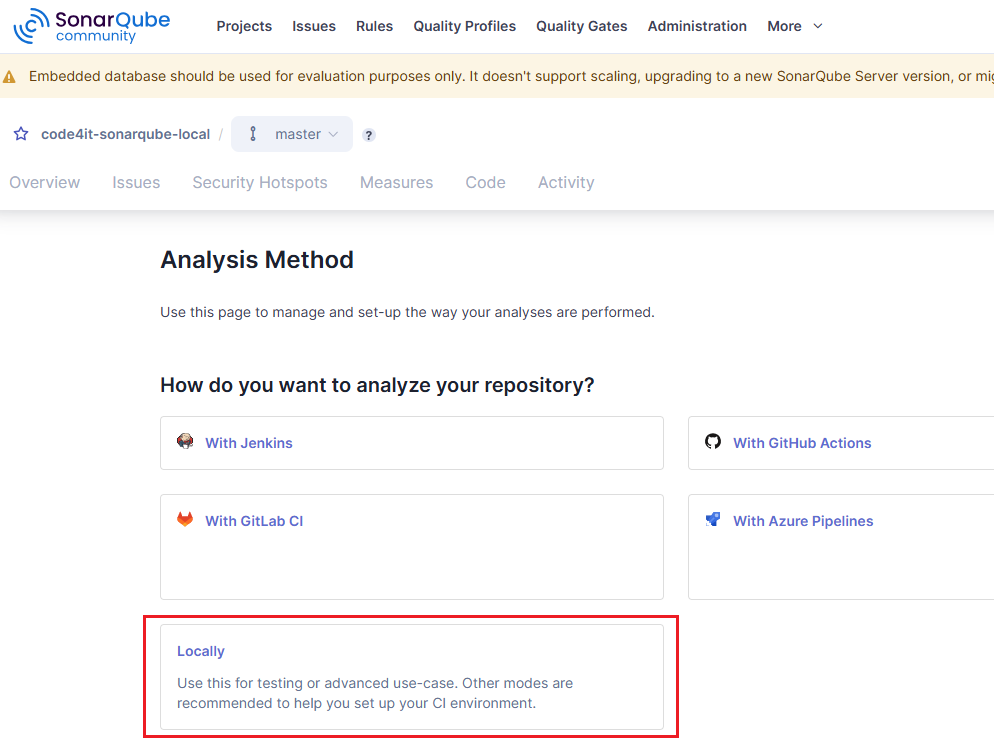
To do that, you have to create a so-called Project. Ideally, you may want to integrate SonarQube into your CI pipeline, but having it run locally is fine for tying it out.
So, on the Projects page, you can create a new project. Click on “Create a local project” and follow the wizard.
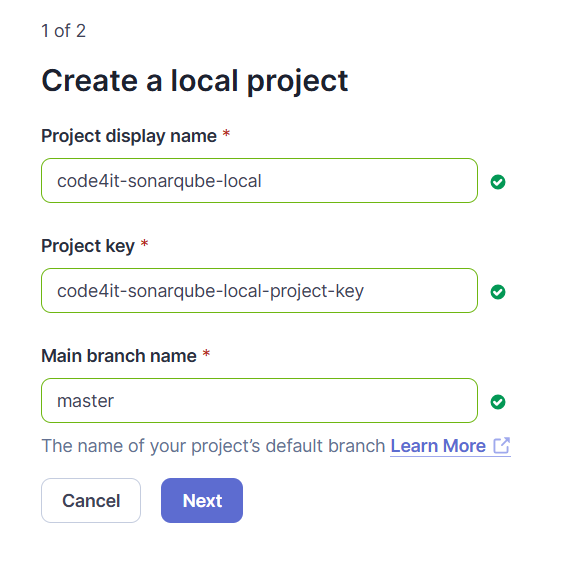
First, create a new Project by defining the Display name (in my case, code4it-sonarqube-local) and the project key (code4it-sonarqube-local-project-key). The Project Key is used in the command line to execute the code analysis using the rules defined in this project.
Also, you have to specify the name of the branch that you will be using as a baseline: generally, it’s either “main” or “master”, but it can be anything.
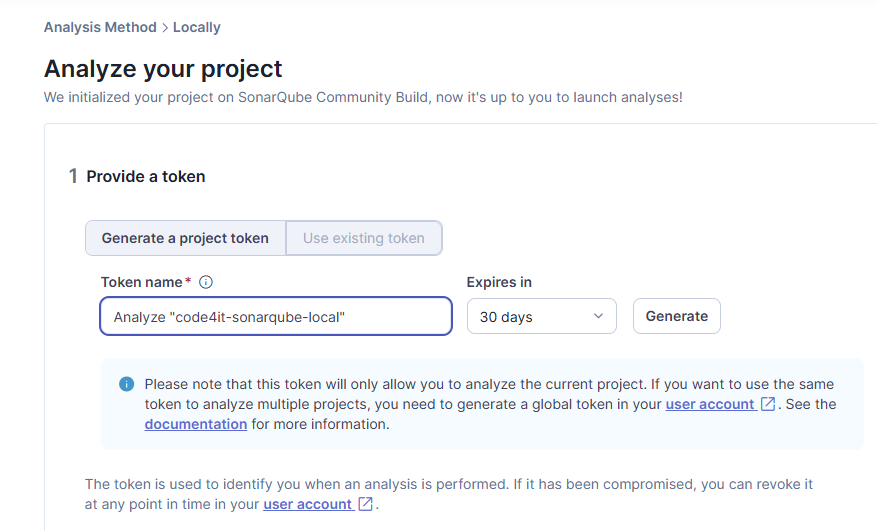
Follow the wizard, choosing some configurations (I suggest you start with the default values), and you’ll end up with a Project ready to be initialised.
Then, you will have to generate a token to run the analysis (I know, it feels like there are too many similar steps. But bear with me; we’re almost ready to run the analysis).
By hitting the “generate” button you’ll see a new token like this: sqp_fd71f97760c84539b579713f18a07c790432cfe8. Remember to store it somewhere, as you’ll gonna be using it later.
The last step is to make sure that you have sonarscanner available as a .NET Core Global Tool in your machine.
Just open a terminal as an administrator and run:
dotnet tool install --global dotnet-sonarscanner
Run the SonarQube analysis on your local repository
Finally, we are ready to run the first analysis of the code!
I suggest you commit all your changes so that you’ll see the files generated by SonarQube.
Open a Terminal, navigate to the root of the Solution, and follow these steps.
Prepare the SonarQube analysis
You first have to instruct SonaQube on the configurations to be used for the current analysis.
The command to run is something like this:
dotnet sonarscanner begin /k:"<your key here>" /d:sonar.host.url="<your-host-root-url>" /d:sonar.token="<your-project-token>"
For my specific execution context, using the values you can see in this article, I have to run the command with the following parameters:
dotnet sonarscanner begin /k:"code4it-sonarqube-local-project-key" /d:sonar.host.url="http://localhost:9001" /d:sonar.token="sqp_fd71f97760c84539b579713f18a07c790432cfe8"
The flags represent the configurations of SonarQube:
/k is the Project Key, as defined before: it contains the rules to be used; /d:sonar.host.url is the url that will receive the result of the analysis, allowing SonarQube to aggregate the issues and display them on a UI; /d:sonar.token is the Token you created before.
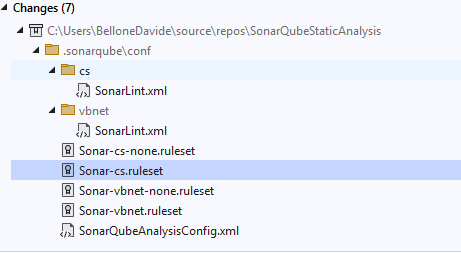
After the command completes, you’ll see that SonarQube created some files to prepare the code analysis. These files contain all the rules under code analysis and their related severity.
From now on, SonarQube will be able to run the analysis and understand how to treat each issue.
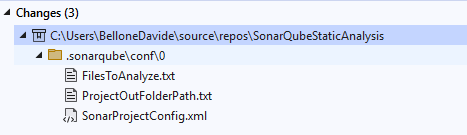
Build the solution
Now you have to build the whole solution, running:
You can, of course, choose to run the command specifying the solution file to build.
Even if it seems trivial, this step is crucial for SonarQube: in fact, it generates some new metadata files that list all the files that have to be taken into account when running the analysis, as well as the path to the output folder:
Run the actual SonarQube analysis
Finally, it’s time to run the actual analysis.
Again, head to the root of the application, and on a terminal run the following command:
dotnet sonarscanner end /d:sonar.token="<your-token>"
In my case, the full command is
dotnet sonarscanner end /d:sonar.token="sqp_fd71f97760c84539b579713f18a07c790432cfe8"
Depending on the size of the project, it will take different amounts of time. For this simple project, it took 7 seconds. For a huge project I worked on, it took almost 2 hours.
Also, the run time depends on the amount of new code to be analyzed: the very first run is the slowest one, and then all the subsequent analyses will focus on the latest code. In fact, most of the issues are stored in a cache.
No new files are created, as the result is directly sent to the SonarQube server.
Navigate the SonarQube report via UI
The result is now available at localhost!
Open a browser, open the website at the port you defined before, and get ready to navigate the status of the static analysis.
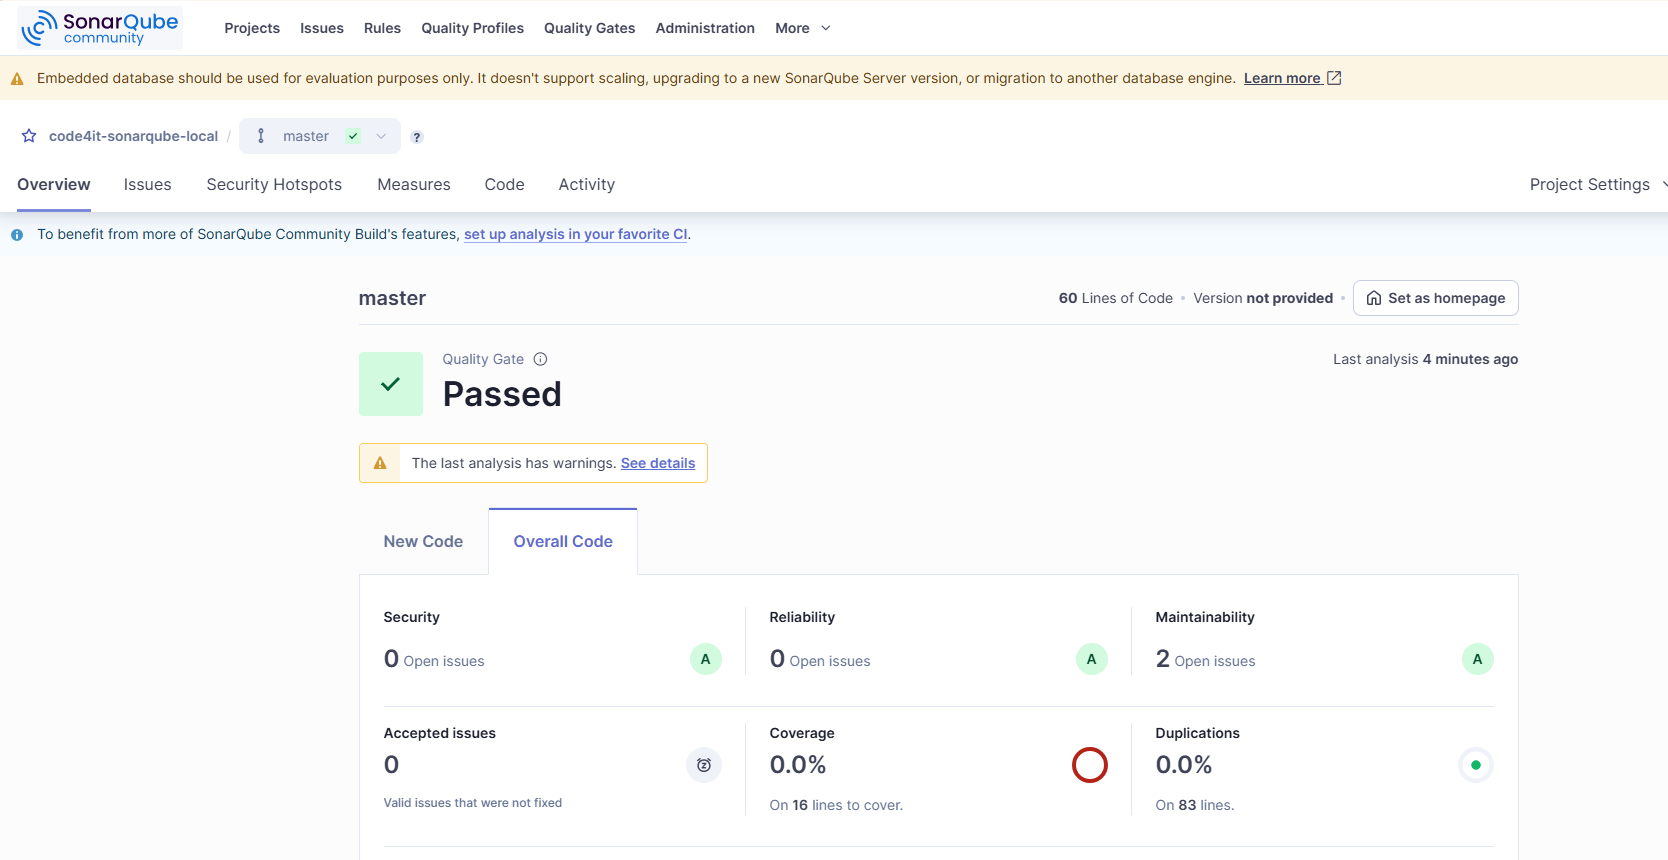
As I was expecting, the project passed the so-called Quality Gates – the minimum level set to consider a project “good”.
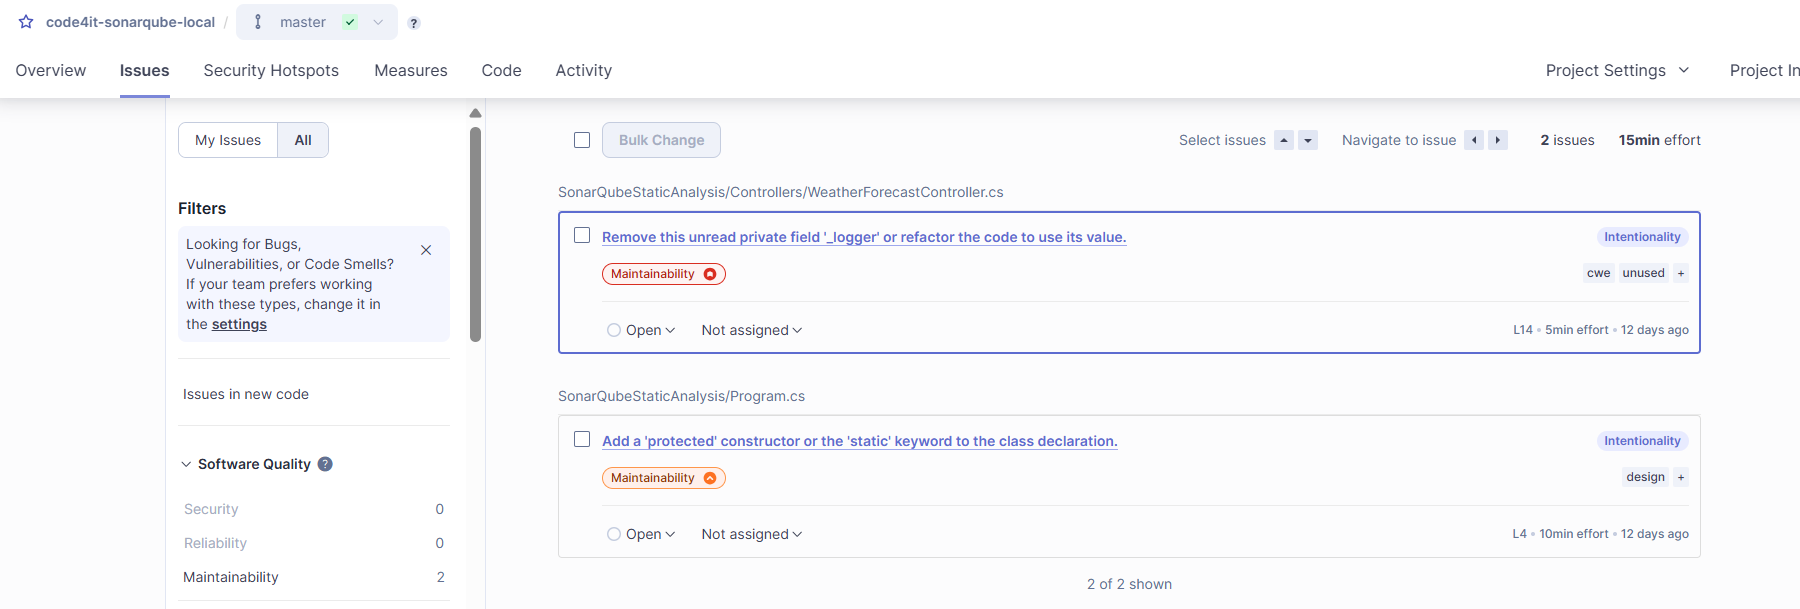
Yet, as you can see under the “Issues” tab, there are actually two issues. For example, there’s a suggested improvement that says to remove the _logger field, it is not used:
Of course, in a more complex project, you’ll find more issues, with different severity.
In this article, I assumed you know the basics of Docker. If not, or if you want to brush up your knowledge about the basics of Docker, here’s an article for you.
We can easily change the background color of div’s even and odd index using the:nth-child pseudo-class with the even and odd keywords, respectively. Odd and even are keywords that can be used to match child elements whose index is odd or even (the index of the first child is 1). Here, we specify two different background colors for odd and even p elements.
In Postman, you can define scripts to be executed before the beginning of a request. Can we use them to work with endpoints using Cookie Authentication?
Table of Contents
Just a second! 🫷 If you are here, it means that you are a software developer.
So, you know that storage, networking, and domain management have a cost .
If you want to support this blog, please ensure that you have disabled the adblocker for this site. I configured Google AdSense to show as few ADS as possible – I don’t want to bother you with lots of ads, but I still need to add some to pay for the resources for my site.
Thank you for your understanding. – Davide
Nowadays, it’s rare to find services that use Cookie Authentication, yet they still exist. How can we configure Cookie Authentication with Postman? How can we centralize the definition using pre-request scripts?
I had to answer these questions when I had to integrate a third-party system that was using Cookie Authentication. Instead of generating a new token manually, I decided to centralize the Cookie creation in a single place, making it automatically available to every subsequent request.
In order to generate the token, I had to send a request to the Authentication endpoint, sending a JSON payload with data coming from Postman’s variables.
In this article, I’ll recap what I learned, teach you some basics of creating pre-request scripts with Postman, and provide a full example of how I used it to centralize the generation and usage of a cookie for a whole Postman collection.
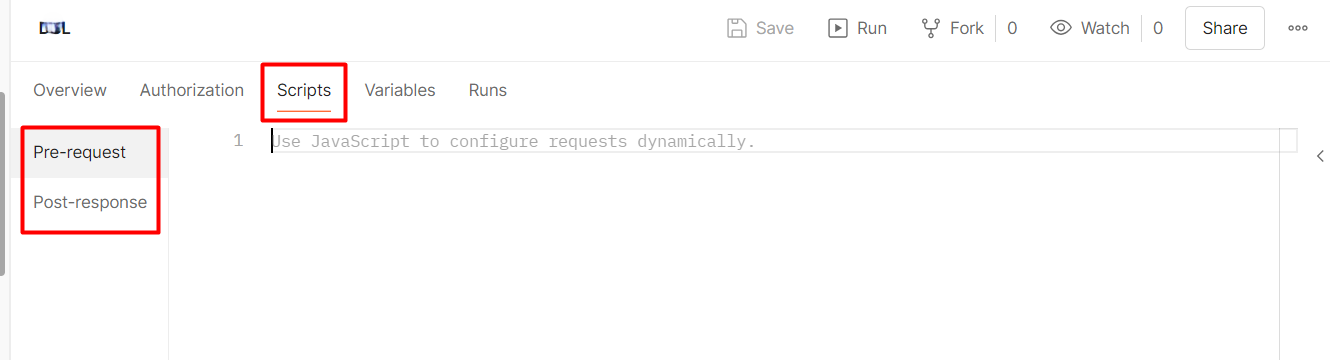
Introducing Postman’s pre-request scripts
As you probably know, Postman allows you to create scripts that are executed before and after an HTTP call.
These scripts are written in JavaScript and can use some objects and methods that come out of the box with Postman.
You can create such scripts for a single request or the whole collection. In the second case, you write the script once so that it becomes available for all the requests stored within that collection.
The operations defined in the Scripts section of the collection are then executed before (or after) every request in the collection.
Here, you can either use the standard JavaScript code—like the dear old console.log— or the pm object to reference the context in which the script will be executed.
For example, you can print the value of a Postman variable by using:
How to send a POST request with JSON body in Postman pre-request scripts
How can we issue a POST request in the pre-request script, specifying a JSON body?
Postman’s pm object, along with some other methods, exposes the sendRequest function. Its first parameter is the “description” of the request; its second parameter is the callback to execute after the request is completed.
pm.sendRequest(request, (errorResponse, successfulResponse) => {
  // do something here
})
You have to carefully craft the request, by specifying the HTTP method, the body, and the content type:
Pay particular attention to the options node: it tells Postman how to treat the body content and what the content type is. Because I was missing this node, I spent too many minutes trying to figure out why this call was badly formed.
options: {
raw: {
language:"json" }
}
Now, the result of the operation is used to execute the callback function. Generally, you want it to be structured like this:
pm.sendRequest(request, (err, response) => {
  if (err) {
    // handle error
  }
  if (response) {
    // handle success
  }
})
Storing Cookies in Postman (using a Jar)
You have received the response with the token, and you have parsed the response to retrieve the value. Now what?
You cannot store Cookies directly as it they were simple variables. Instead, you must store Cookies in a Jar.
Postman allows you to programmatically operate with cookies only by accessing them via a Jar (yup, pun intended!), that can be initialized like this:
constjar=pm.cookies.jar()
From here, you can add, remove or retrieve cookies by working with the jar object.
To add a new cookie, you must use the set() method of the jar object, specifying the domain the cookie belongs to, its name, its value, and the callback to execute when the operation completes.
You can try it now: execute a request, have a look at the console logs, and…
We’ve received a strange error:
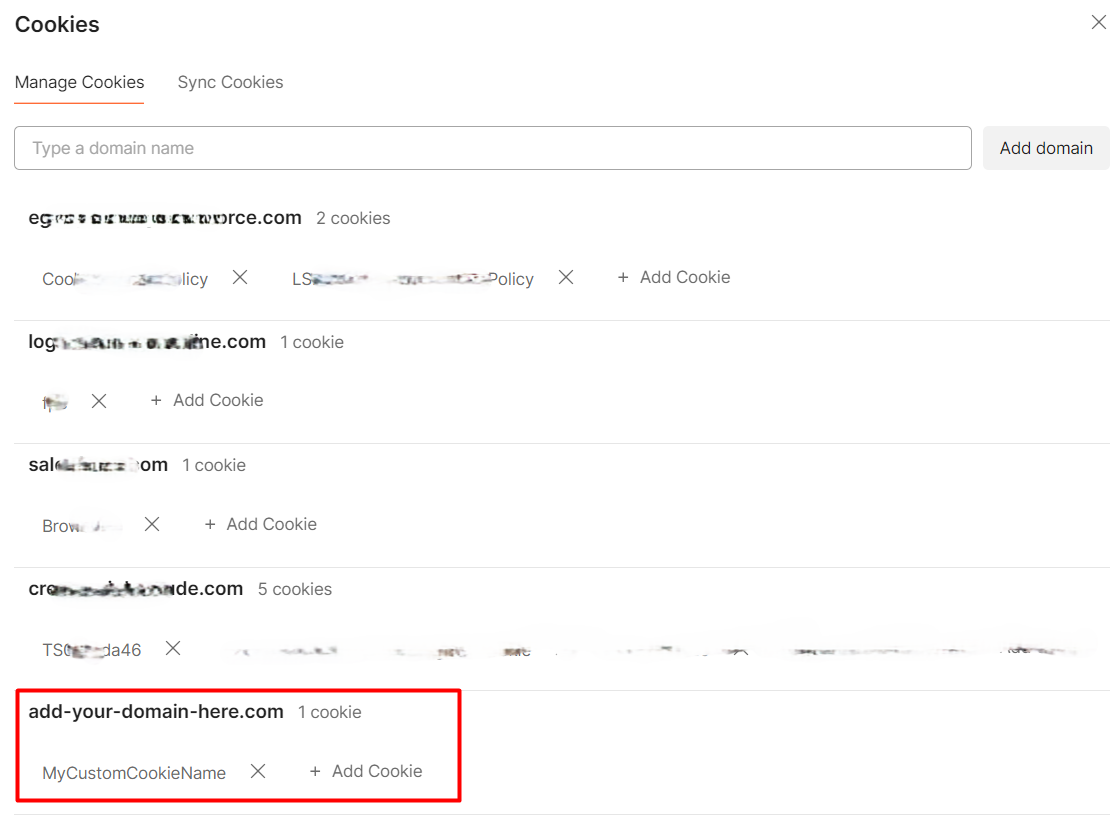
An error occurred: Error: CookieStore: programmatic access to “add-your-domain-here.com” is denied
Wait, what? What does “programmatic access to X is denied” mean, and how can we solve this error?
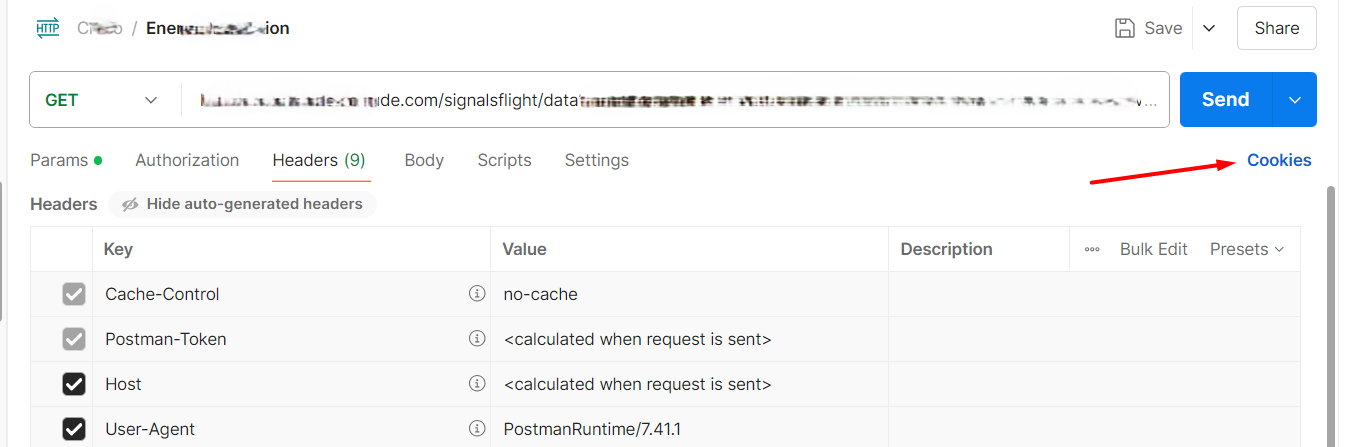
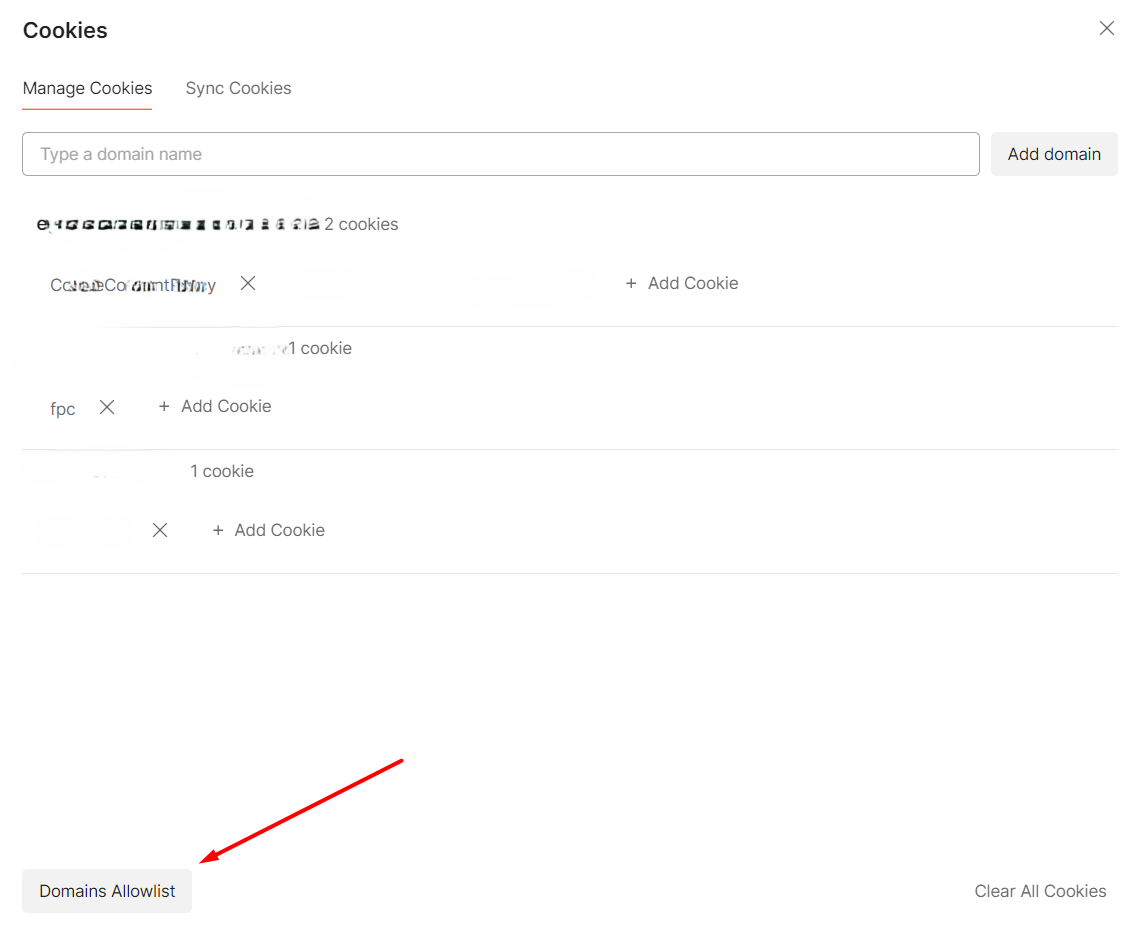
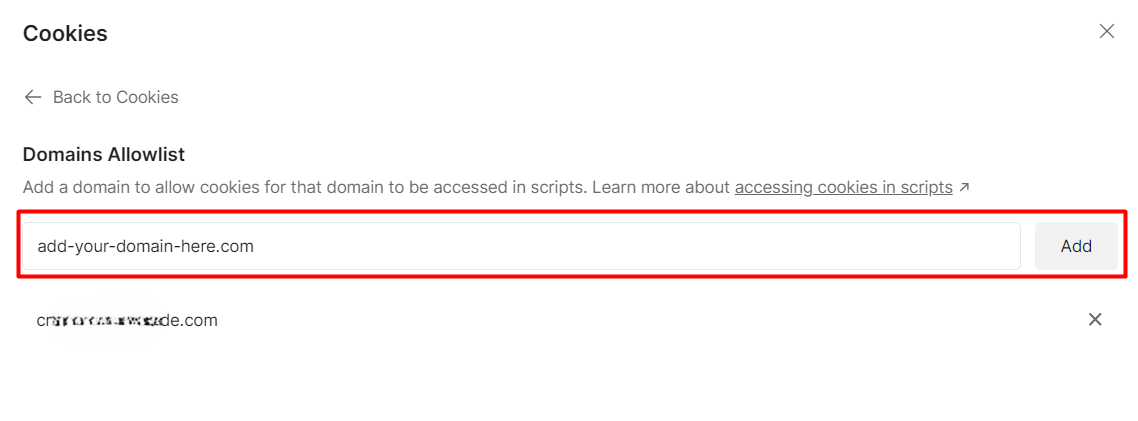
For security reasons, you cannot handle cookies via code without letting Postman know that you explicitly want to operate on the specified domain. To overcome this limitation, you need to whitelist the domain associated with the cookie so that Postman will accept that the operation you’re trying to achieve via code is legit.
To enable a domain for cookies operations, you first have to navigate to the headers section of any request under the collection and click the Cookies button.
From here, select Domains Allowlist:
Finally, add your domain to the list of the allowed ones.
Now Postman knows that if you try to set a cookie via code, it’s because you actively want it, allowing you to add your cookies to the jar.
If you open again the Cookie section (see above), you will be able to see the current values for the cookies associated with the domain:
Further readings
Clearly, we’ve just scratched the surface of what you can do with pre-request scripts in Postman. To learn more, have a look at the official documentation:
In this article, we learned what pre-request scripts are, how to execute a POST request passing a JSON object as a body, and how to programmatically add a Cookie in Postman by operating on the Jar object.
For clarity, here’s the complete code I used in my pre-request script.
Notice that to parse the response from the authentication endpoint I used the .json() method, that allows me to access the internal values using the property name, as in jresponse["Token"].
I hope you enjoyed this article! Let’s keep in touch on Twitter or LinkedIn! 🤜🤛
In the modern digital era, QR codes have become essential for quickly sharing information through a simple scan. QR codes provide a versatile solution for marketing purposes, linking to a website, or sharing contact details. In this blog post, we’ll explore how to generate QR codes in your Angular applications using the angularx-qrcode library.
We’ll guide you through the installation process, show you how to integrate the library into your Angular project and provide a complete example to get you started. By the end of this tutorial, you’ll be able to create and customize QR codes effortlessly, adding an extra layer of interactivity and functionality to your applications. Perfect for developers of all levels, this step-by-step guide ensures you can implement QR code generation quickly and efficiently. Join us as we dive into the world of QR codes and enhance your Angular projects with this powerful feature!
Below are the steps to implement it.
Step 1: Set Up Your Angular Project.
If you don’t have an existing Angular project, create a new one using the Angular CLI:
ng new qr-code-app
cd qr-code-app
Step 2: Install angularx-qrcode
Install the angularx-qrcode library using npm:
npm install angularx-qrcode
Step 3: Create a Component and import the QRCodeModule.
import { Component } from '@angular/core';
import { MatFormFieldModule } from '@angular/material/form-field';
import { QrCodeModule } from 'ng-qrcode';


@Component({
  selector: 'app-qrcode',
  standalone: true,
  imports: [MatFormFieldModule,QrCodeModule],
  templateUrl: './qrcode.component.html',
  styleUrl: './qrcode.component.css'
})
export class QrcodeComponent {

  value: string = 'QRCODE Generator';
}
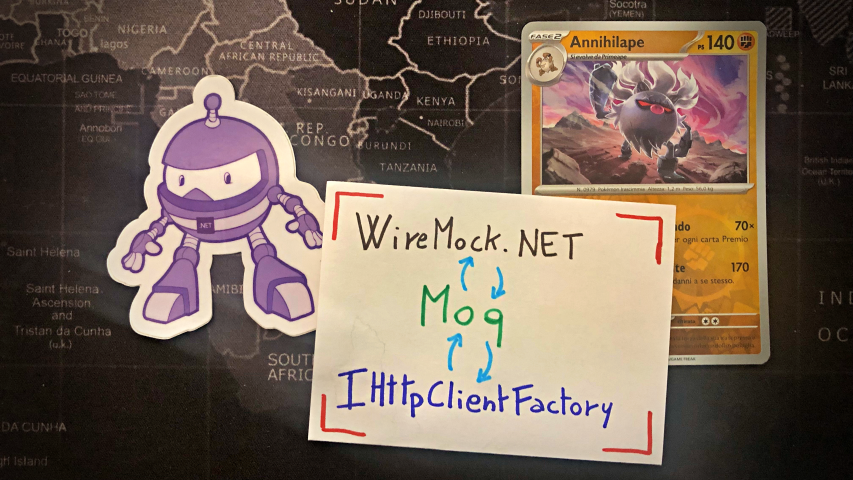
WireMock.NET is a popular library used to simulate network communication through HTTP. But there is no simple way to integrate the generated in-memory server with an instance of IHttpClientFactory injected via constructor. Right? Wrong!
Table of Contents
Just a second! 🫷 If you are here, it means that you are a software developer.
So, you know that storage, networking, and domain management have a cost .
If you want to support this blog, please ensure that you have disabled the adblocker for this site. I configured Google AdSense to show as few ADS as possible – I don’t want to bother you with lots of ads, but I still need to add some to pay for the resources for my site.
Thank you for your understanding. – Davide
Testing the integration with external HTTP clients can be a cumbersome task, but most of the time, it is necessary to ensure that a method is able to perform correct operations – not only sending the right information but also ensuring that we are able to read the content returned from the called API.
Instead of spinning up a real server (even if in the local environment), we can simulate a connection to a mock server. A good library for creating temporary in-memory servers is WireMock.NET.
Many articles I read online focus on creating a simple HttpClient, using WireMock.NET to drive its behaviour. In this article, we are going to do a little step further: we are going to use WireMock.NET to handle HttpClients generated, using Moq, via IHttpClientFactory.
Explaining the dummy class used for the examples
As per every practical article, we must start with a dummy example.
For the sake of this article, I’ve created a dummy class with a single method that calls an external API to retrieve details of a book and then reads the returned content. If the call is successful, the method returns an instance of Book; otherwise, it throws a BookServiceException exception.
Just for completeness, here’s the Book class:
publicclassBook{
publicint Id { get; set; }
publicstring Title { get; set; }
}
publicclassBookService{
privatereadonly IHttpClientFactory _httpClientFactory;
public BookService(IHttpClientFactory httpClientFactory)
{
_httpClientFactory = httpClientFactory;
}
publicasync Task<Book> GetBookById(int id)
{
string url = $"/api/books/{id}";
HttpClient httpClient = _httpClientFactory.CreateClient("books_client");
try {
Book? book = await httpClient.GetFromJsonAsync<Book>(url);
return book;
}
catch (Exception ex)
{
thrownew BookServiceException($"There was an error while getting info about the book {id}", ex);
}
}
}
There are just two things to notice:
We are injecting an instance of IHttpClientFactory into the constructor.
We are generating an instance of HttpClient by passing a name to the CreateClient method of IHttpClientFactory.
Now that we have our cards on the table, we can start!
WireMock.NET, a library to simulate HTTP calls
WireMock is an open-source platform you can install locally to create a real mock server. You can even create a cloud environment to generate and test HTTP endpoints.
However, for this article we are interested in the NuGet package that takes inspiration from the WireMock project, allowing .NET developers to generate disposable in-memory servers: WireMock.NET.
To add the library, you must add the WireMock.NET NuGet package to your project, for example using dotnet add package WireMock.Net.
Once the package is ready, you can generate a test server in your Unit Tests class:
You can instantiate a new instance of WireMockServer in the OneTimeSetUp step, store it in a private field, and make it accessible to every test in the test class.
Before each test run, you can reset the internal status of the mock server by running the Reset() method. I’d suggest you reset the server to avoid unintentional internal status, but it all depends on what you want to do with the server instance.
Finally, remember to free up resources by calling the Stop() method in the OneTimeTearDown phase (but not during the TearDown phase: you still need the server to be on while running your tests!).
Basic configuration of HTTP requests and responses with WireMock.NET
The basic structure of the definition of a mock response using WireMock.NET is made of two parts:
Within the Given method, you define the HTTP Verb and URL path whose response is going to be mocked.
Using RespondWith you define what the mock server must return when the endpoint specified in the Given step is called.
In the next example, you can see that the _server instance (the one I instantiated in the OneTimeSetUp phase, remember?) must return a specific body (responseBody) and the 200 HTTP Status Code when the /api/books/42 endpoint is called.
All in all, both the request and the response are highly customizable: you can add HTTP Headers, delays, cookies, and much more.
Look closely; there’s one part that is missing: What is the full URL? We have declared only the path (/api/books/42) but have no info about the hostname and the port used to communicate.
How to integrate WireMock.NET with a Moq-driven IHttpClientFactory
In order to have WireMock.NET react to an HTTP call, we have to call the exact URL – even the hostname and port must match. But when we create a mocked HttpClient – like we did in this article – we don’t have a real hostname. So, how can we have WireMock.NET and HttpClient work together?
The answer is easy: since WireMockServer.Start() automatically picks a free port in your localhost, you don’t have to guess the port number, but you can reference the current instance of _server.
Once the WireMockServer is created, internally it contains the reference to one or more URLs it will use to listen for HTTP requests, intercepting the calls and replying in place of a real server. You can then use one of these ports to configure the HttpClient generated by the HttpClientFactory.
Let’s see the code:
[Test]publicasync Task GetBookById_Should_HandleBadRequests()
{
string baseUrl = _server.Url;
HttpClient myHttpClient = new HttpClient() { BaseAddress = new Uri(baseUrl) };
Mock<IHttpClientFactory> mockFactory = new Mock<IHttpClientFactory>();
mockFactory.Setup(_ => _.CreateClient("books_client")).Returns(myHttpClient);
_server
.Given(Request.Create().WithPath("/api/books/42").UsingGet())
.RespondWith(
  Response.Create()
 .WithStatusCode(404)
);
BookService service = new BookService(mockFactory.Object);
Assert.CatchAsync<BookServiceException>(() => service.GetBookById(42));
}
First we access the base URL used by the mock server by accessing _server.Url.
We use that URL as a base address for the newly created instance of HttpClient.
Then, we create a mock of IHttpClientFactory and configure it to return the local instance of HttpClient whenever we call the CreateClient method with the specified name.
In the meanwhile, we define how the mock server must behave when an HTTP call to the specified path is intercepted.
Finally, we can pass the instance of the mock IHttpClientFactory to the BookService.
So, the key part to remember is that you can simply access the Url property (or, if you have configured it to handle many URLs, you can access the Urls property, that is an array of strings).
Let WireMock.NET create the HttpClient for you
As suggested by Stef in the comments to this post, there’s actually another way to generate the HttpClient with the correct URL: let WireMock.NET do it for you.
Instead of doing
string baseUrl = _server.Url;

HttpClient myHttpClient = new HttpClient() { BaseAddress = new Uri(baseUrl) };
you can simplify the process by calling the CreateClient method:
HttpClient myHttpClient = _server.CreateClient();
Of course, you will still have to pass the instance to the mock of IHttpClientFactory.
Further readings
It’s important to notice that WireMock and WireMock.NET are two totally distinct things: one is a platform, and one is a library, owned by a different group of people, that mimics some functionalities from the platform to help developers write better tests.
WireMock.NET is greatly integrated with many other libraries, such as xUnit, FluentAssertions, and .NET Aspire.
It’s important to remember that using an HttpClientFactory is generally more performant than instantiating a new HttpClient. Ever heard of socket exhaustion?
Finally, for the sake of this article I’ve used Moq. However, there’s a similar library you can use: NSubstitute. The learning curve is quite flat: in the most common scenarios, it’s just a matter of syntax usage.
In this article, we almost skipped all the basic stuff about WireMock.NET and tried to go straight to the point of integrating WireMock.NET with IHttpClientFactory.
There are lots of articles out there that explain how to use WireMock.NET – just remember that WireMock and WireMock.NET are not the same thing!
I hope you enjoyed this article! Let’s keep in touch on LinkedIn or Twitter! 🤜🤛
As organizations continue to embrace hybrid work models and migrate applications to the cloud, traditional network security approaches like VPNs are proving inadequate. Zero-trust network Access (ZTNA) has emerged as the modern framework for secure access, operating on the principle of “never trust, always verify.” However, with numerous vendors offering different ZTNA solutions, selecting the right one requires careful consideration of organizational needs, solution types, key features, and implementation factors.
Assessing Organizational Requirements
The first step in selecting a ZTNA solution is thoroughly evaluating your organization’s specific needs. Consider the nature of your workforce: do employees work remotely, in-office, or in a hybrid arrangement? The solution must accommodate secure access from various locations while ensuring productivity. Additionally, assess whether third-party vendors or contractors require controlled access to specific resources, as this will influence whether an agent-based or agentless approach is more suitable.
Another critical factor is the sensitivity of the data and applications being accessed. Organizations handling financial, healthcare, or other regulated data must ensure the ZTNA solution complies with industry standards such as GDPR, HIPAA, or SOC 2. Furthermore, examine how the solution integrates with your existing security infrastructure, including identity and access management (IAM) systems, endpoint detection and response (EDR) tools, and security information and event management (SIEM) platforms. A seamless integration ensures cohesive security policies and reduces operational complexity.
Understanding ZTNA Deployment Models
ZTNA solutions generally fall into two primary categories: service-initiated (agent-based) and network-initiated (agentless). Service-initiated ZTNA requires installing a lightweight agent on user devices, which then connects to a cloud-based broker that enforces access policies. This model is ideal for organizations with managed corporate devices, as it provides granular control over endpoint security.
On the other hand, network-initiated ZTNA does not require software installation. Instead, users access resources through a web portal or browser, enforcing policies via DNS or routing controls. This approach is better suited for third-party users or unmanaged devices, offering flexibility without compromising security. Some vendors provide hybrid models that combine both approaches, allowing organizations to tailor access based on user roles and device types.
Essential Features of a Robust ZTNA Solution
When evaluating ZTNA providers, prioritize solutions that offer strong identity-centric security. Multi-factor authentication (MFA) and continuous authentication mechanisms, such as behavioral analytics, ensure that only verified users gain access. Role-based access control (RBAC) further enhances security by enforcing the principle of least privilege, granting users access only to the resources they need.
Granular access controls are another critical feature. Look for solutions that provide application-level segmentation rather than just network-level controls. Context-aware policies, which consider device posture, geographic location, and time of access, add a layer of security.
Moreover, A robust ZTNA solution should include several other essential features to ensure security and flexibility. It must support user device binding to associate users with their specific devices securely. Additionally, it should support local users in accommodating on-premises authentication needs. Compatibility with legacy identity providers (IdPs) is crucial for seamless integration with existing systems. Furthermore, the solution should enable session recording over various protocols to enhance monitoring and compliance.
Integration capabilities should not be overlooked. The ideal ZTNA solution should seamlessly connect with existing security tools, such as SIEM and SOAR platforms, for centralized monitoring and incident response. Additionally, API-based automation can streamline policy management, reducing administrative overhead. Finally, user experience plays a pivotal role in adoption. Features like single sign-on (SSO) and fast, reliable connectivity help maintain productivity while ensuring security.
Evaluating Deployment and Cost Considerations
Implementation complexity and cost are decisive factors in choosing a ZTNA solution. Cloud-based ZTNA, delivered as a SaaS offering, typically involves minimal deployment effort and is ideal for organizations with predominantly cloud-based applications. While offering greater control, on-premises deployments require more extensive setup and maintenance, making them better suited for highly regulated industries with strict data residency requirements. Hybrid models strike a balance, catering to organizations with mixed infrastructure.
Cost structures vary among providers, with some offering per-user licensing and others charging based on application access. Be mindful of potential hidden costs, such as bandwidth usage or fees for additional security integrations. Conducting a proof-of-concept (POC) trial can provide valuable insights into the solution’s real-world performance and help justify investment by demonstrating potential cost savings, such as reduced VPN expenses or improved security efficiency.
Conclusion: Making an Informed Decision
Choosing the right ZTNA solution demands a structured approach. Begin by assessing your organization’s unique requirements, including workforce dynamics, data sensitivity, and existing security infrastructure. Next, understand the different deployment models to determine whether an agent-based, agentless, or hybrid solution aligns with your needs. Prioritize features that enhance security without compromising usability and carefully evaluate deployment efforts and costs to ensure smooth implementation.
By following this comprehensive guide, organizations can adopt a ZTNA solution that strengthens security and supports operational efficiency and scalability. As the threat landscape evolves, a well-chosen ZTNA framework will provide flexibility and resilience to safeguard critical assets in an increasingly perimeter-less world.
Discover how Seqrite ZTNA can transform your organization’s security with a robust, cloud-native zero-trust solution tailored for modern enterprises. Contact us today or request a demo to start your journey toward a more secure and efficient network!
Understanding the Fetch API can be challenging, particularly for those new to JavaScript’s unique approach to handling asynchronous operations. Among the many features of modern JavaScript, the Fetch API stands out for its ability to handle network requests elegantly. However, the syntax of chaining .then() methods can seem unusual at first glance. To fully grasp how the Fetch API works, it’s vital to understand three core concepts:
In programming, synchronous code is executed in sequence. Each statement waits for the previous one to finish before executing. JavaScript, being single-threaded, runs code in a linear fashion. However, certain operations, like network requests, file system tasks, or timers, could block this thread, making the user experience unresponsive.
Here’s a simple example of synchronous code:
function doTaskOne() { console.log('Task 1 completed'); }
function doTaskTwo() { console.log('Task 2 completed'); }