Once we have a Postgres instance running, we can perform operations on it. We will use Npgsql to query a Postgres instance with C#
Table of Contents
Just a second! 🫷
If you are here, it means that you are a software developer.
So, you know that storage, networking, and domain management have a cost .If you want to support this blog, please ensure that you have disabled the adblocker for this site.
I configured Google AdSense to show as few ADS as possible – I don’t want to bother you with lots of ads, but I still need to add some to pay for the resources for my site.Thank you for your understanding.
– Davide
PostgreSQL is one of the most famous relational databases. It has got tons of features, and it is open source.
In a previous article, we’ve seen how to run an instance of Postgres by using Docker.
In this article, we will learn how to perform CRUD operations in C# by using Npgsql.
Introducing the project
To query a Postgres database, I’ve created a simple .NET API application with CRUD operations.
We will operate on a single table that stores info for my board game collection. Of course, we will Create, Read, Update and Delete items from the DB (otherwise it would not be an article about CRUD operations 😅).
Before starting writing, we need to install Npgsql, a NuGet package that acts as a dataprovider for PostgreSQL.
Open the connection
Once we have created the application, we can instantiate and open a connection against our database.
private NpgsqlConnection connection;

public NpgsqlBoardGameRepository()
{
    connection = new NpgsqlConnection(CONNECTION_STRING);
    connection.Open();
}
We simply create a NpgsqlConnection object, and we keep a reference to it. We will use that reference to perform queries against our DB.
Connection string
The only parameter we can pass as input to the NpgsqlConnection constructor is the connection string.
You must compose it by specifying the host address, the port, the database name we are connecting to, and the credentials of the user that is querying the DB.
private const string CONNECTION_STRING = "Host=localhost:5455;" +
    "Username=postgresUser;" +
    "Password=postgresPW;" +
    "Database=postgresDB";
If you instantiate Postgres using Docker following the steps I described in a previous article, most of the connection string configurations we use here match the Environment variables we’ve defined before.
CRUD operations
Now that everything is in place, it’s time to operate on our DB!
We are working on a table, Games, whose name is stored in a constant:
private const string TABLE_NAME = "Games";
The Games table consists of several fields:
| Field name | Field type |
|---|---|
| id | INTEGER PK |
| Name | VARCHAR NOT NULL |
| MinPlayers | SMALLINT NOT NULL |
| MaxPlayers | SMALLINT |
| AverageDuration | SMALLINT |
This table is mapped to the BoardGame class:
public class BoardGame
{
    public int Id { get; set; }
    public string Name { get; set; }
    public int MinPlayers { get; set; }
    public int MaxPlayers { get; set; }
    public int AverageDuration { get; set; }
}
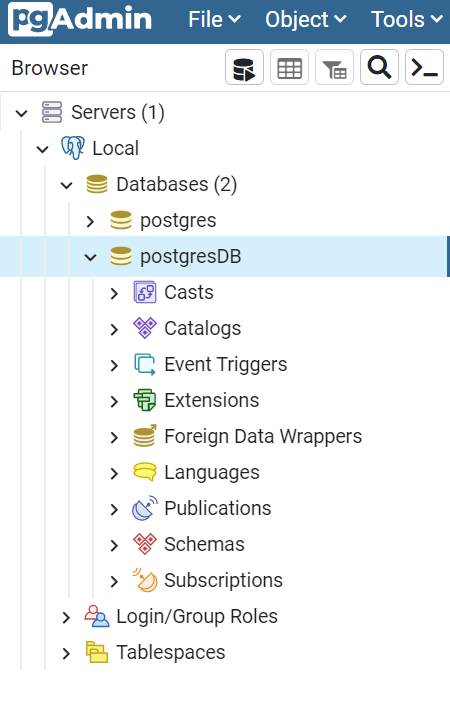
To double-check the results, you can use a UI tool to access the Database. For instance, if you use pgAdmin, you can find the list of databases running on a host.
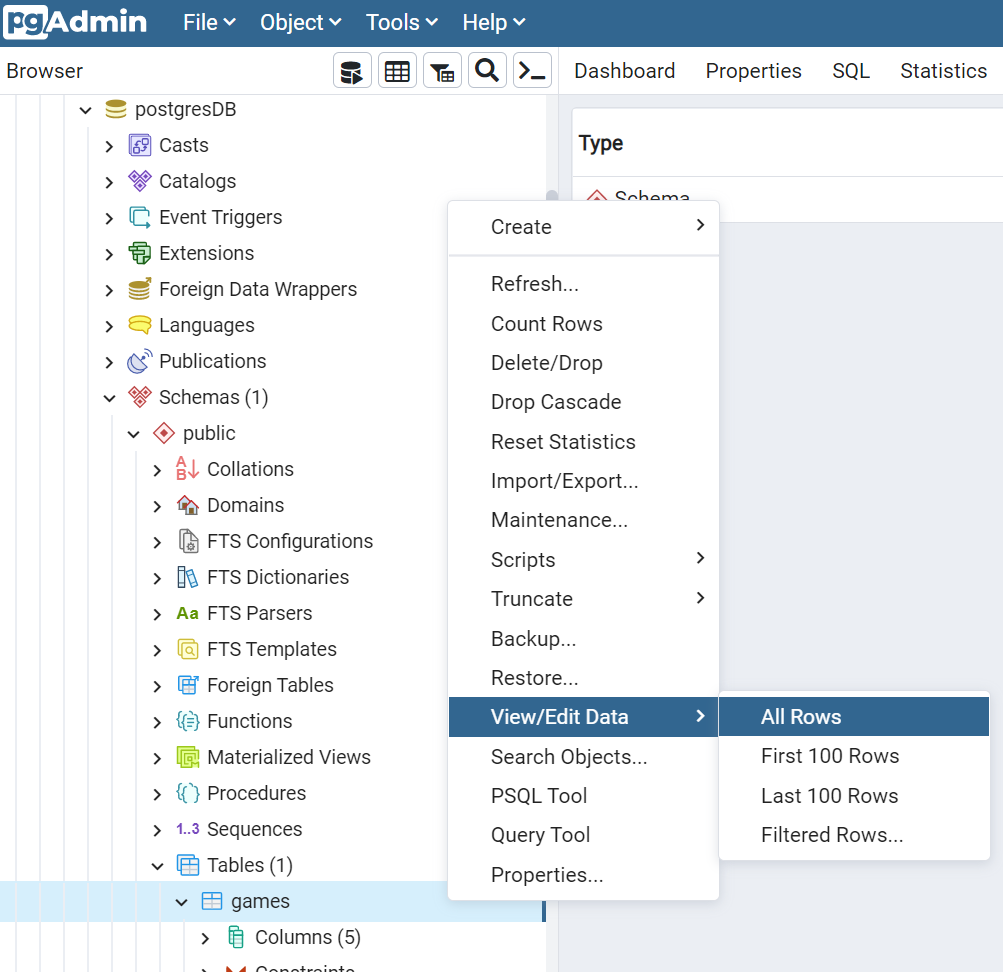
And, if you want to see the content of a particular table, you can select it under Schemas>public>Tables>tablename, and then select View>AllRows
Create
First things first, we have to insert some data in our DB.
public async Task Add(BoardGame game)
{
    string commandText = $"INSERT INTO {TABLE_NAME} (id, Name, MinPlayers, MaxPlayers, AverageDuration) VALUES (@id, @name, @minPl, @maxPl, @avgDur)";
    await using (var cmd = new NpgsqlCommand(commandText, connection))
    {
        cmd.Parameters.AddWithValue("id", game.Id);
        cmd.Parameters.AddWithValue("name", game.Name);
        cmd.Parameters.AddWithValue("minPl", game.MinPlayers);
        cmd.Parameters.AddWithValue("maxPl", game.MaxPlayers);
        cmd.Parameters.AddWithValue("avgDur", game.AverageDuration);

        await cmd.ExecuteNonQueryAsync();
    }
}
The commandText string contains the full command to be issued. In this case, it’s a simple INSERT statement.
We use the commandText string to create a NpgsqlCommandobject by specifying the query and the connection where we will perform that query. Note that the command must be Disposed after its use: wrap it in a using block.
Then, we will add the parameters to the query. AddWithValue accepts two parameters: the first is the name of the key, with the same name defined in the query, but without the @ symbol; in the query, we use @minPl, and as a parameter, we use minPl.
Never, never, create the query by concatenating the input params as a string, to avoid SQL Injection attacks.
Finally, we can execute the query asynchronously with ExecuteNonQueryAsync.
Read
Now that we have some games stored in our table, we can retrieve those items:
public async Task<BoardGame> Get(int id)
{
    string commandText = $"SELECT * FROM {TABLE_NAME} WHERE ID = @id";
    await using (NpgsqlCommand cmd = new NpgsqlCommand(commandText, connection))
    {
        cmd.Parameters.AddWithValue("id", id);

        await using (NpgsqlDataReader reader = await cmd.ExecuteReaderAsync())
            while (await reader.ReadAsync())
            {
                BoardGame game = ReadBoardGame(reader);
                return game;
            }
    }
    return null;
}
Again, we define the query as a text, use it to create a NpgsqlCommand, specify the parameters’ values, and then we execute the query.
The ExecuteReaderAsync method returns a NpgsqlDataReader object that we can use to fetch the data. We update the position of the stream with reader.ReadAsync(), and then we convert the current data with ReadBoardGame(reader) in this way:
private static BoardGame ReadBoardGame(NpgsqlDataReader reader)
{
    int? id = reader["id"] as int?;
    string name = reader["name"] as string;
    short? minPlayers = reader["minplayers"] as Int16?;
    short? maxPlayers = reader["maxplayers"] as Int16?;
    short? averageDuration = reader["averageduration"] as Int16?;

    BoardGame game = new BoardGame
    {
        Id = id.Value,
        Name = name,
        MinPlayers = minPlayers.Value,
        MaxPlayers = maxPlayers.Value,
        AverageDuration = averageDuration.Value
    };
    return game;
}
This method simply reads the data associated with each column (for instance, reader["averageduration"]), then we convert them to their data type. Then we build and return a BoardGame object.
Update
Updating items is similar to inserting a new item.
public async Task Update(int id, BoardGame game)
{
    var commandText = $@"UPDATE {TABLE_NAME}
                SET Name = @name, MinPlayers = @minPl, MaxPlayers = @maxPl, AverageDuration = @avgDur
                WHERE id = @id";

    await using (var cmd = new NpgsqlCommand(commandText, connection))
    {
        cmd.Parameters.AddWithValue("id", game.Id);
        cmd.Parameters.AddWithValue("name", game.Name);
        cmd.Parameters.AddWithValue("minPl", game.MinPlayers);
        cmd.Parameters.AddWithValue("maxPl", game.MaxPlayers);
        cmd.Parameters.AddWithValue("avgDur", game.AverageDuration);

        await cmd.ExecuteNonQueryAsync();
    }
}
Of course, the query is different, but the general structure is the same: create the query, create the Command, add parameters, and execute the query with ExecuteNonQueryAsync.
Delete
Just for completeness, here’s how to delete an item by specifying its id.
public async Task Delete(int id)
{
    string commandText = $"DELETE FROM {TABLE_NAME} WHERE ID=(@p)";
    await using (var cmd = new NpgsqlCommand(commandText, connection))
    {
        cmd.Parameters.AddWithValue("p", id);
        await cmd.ExecuteNonQueryAsync();
    }
}
Always the same story, so I have nothing to add.
ExecuteNonQueryAsync vs ExecuteReaderAsync
As you’ve seen, some operations use ExecuteNonQueryAsync, while some others use ExecuteReaderAsync. Why?
ExecuteNonQuery and ExecuteNonQueryAsync execute commands against a connection. Those methods do not return data from the database, but only the number of rows affected. They are used to perform INSERT, UPDATE, and DELETE operations.
On the contrary, ExecuteReader and ExecuteReaderAsync are used to perform queries on the database and return a DbDataReader object, which is a read-only stream of rows retrieved from the data source. They are used in conjunction with SELECT queries.
Bonus 1: Create the table if not already existing
Of course, you can also create tables programmatically.
public async Task CreateTableIfNotExists()
{
    var sql = $"CREATE TABLE if not exists {TABLE_NAME}" +
        $"(" +
        $"id serial PRIMARY KEY, " +
        $"Name VARCHAR (200) NOT NULL, " +
        $"MinPlayers SMALLINT NOT NULL, " +
        $"MaxPlayers SMALLINT, " +
        $"AverageDuration SMALLINT" +
        $")";

    using var cmd = new NpgsqlCommand(sql, connection);

    await cmd.ExecuteNonQueryAsync();
}
Again, nothing fancy: create the command text, create a NpgsqlCommand object, and execute the command.
Bonus 2: Check the database version
To check if the database is up and running, and your credentials are correct (those set in the connection string), you might want to retrieve the DB version.
You can do it in 2 ways.
With the following method, you query for the version directly on the database.
public async Task<string> GetVersion()
{
    var sql = "SELECT version()";

    using var cmd = new NpgsqlCommand(sql, connection);

    var versionFromQuery = (await cmd.ExecuteScalarAsync()).ToString();

    return versionFromQuery;
}
This method returns lots of info that directly depend on the database instance. In my case, I see PostgreSQL 14.1 (Debian 14.1-1.pgdg110+1) on x86_64-pc-linux-gnu, compiled by gcc (Debian 10.2.1-6) 10.2.1 20210110, 64-bit.
The other way is to use PostgreSqlVersion.
public async Task<string> GetVersion()
{
    var versionFromConnection = connection.PostgreSqlVersion;

    return versionFromConnection;
}
PostgreSqlVersion returns a Version object containing some fields like Major, Minor, Revision, and more.
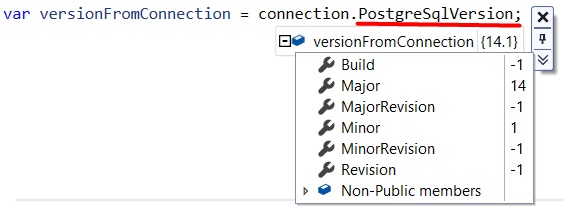
You can call the ToString method of that object to get a value like “14.1”.
Additional readings
In a previous article, we’ve seen how to download and run a PostgreSQL instance on your local machine using Docker.
🔗 How to run PostgreSQL locally with Docker | Code4IT
To query PostgreSQL with C#, we used the Npsgql NuGet package. So, you might want to read the official documentation.
🔗 Npgsql documentation | Npsgql
In particular, an important part to consider is the mapping between C# and SQL data types:
🔗 PostgreSQL to C# type mapping | Npsgql
When talking about parameters to be passed to the query, I mentioned the SQL Injection vulnerability. Here you can read more about it.
Finally, here you can find the repository used for this article.
🔗 Repository used for this article | GitHub
This article first appeared on Code4IT 🐧
Wrapping up
In this article, we’ve learned how to perform simple operations on a PostgreSQL database to retrieve and update the content of a table.
This is the most basic way to perform those operations. You explicitly write the queries and issue them without much stuff in between.
In future articles, we will see some other ways to perform the same operations in C#, but using other tools and packages. Maybe Entity Framework? Maybe Dapper? Stay tuned!
Happy coding!
🐧