برچسب: The

  • A Deep Dive into the UNC6040 Cyber Attack

    A Deep Dive into the UNC6040 Cyber Attack


    Executive Summary

    In early June 2025, Google’s corporate Salesforce instance (used to store contact data for small‑ and medium‑sized business clients) was compromised through a sophisticated vishing‑extortion campaign orchestrated by the threat‑group tracked as UNC6040 & UNC6240 (online cybercrime collective known as “The Com” linked to “ShinyHunters).”

    The attackers combined three core vectors:

    1. Voice‑phishing (vishing) – Impersonating IT staff in a convincing phone call, persuading a Google employee to approve a malicious application connected to Salesforce, a rapid‑reply extortion scheme demanding Bitcoin payments within 72 hrs.
    2. OAuth app abuse – the deployment of custom Python scripts that emulate Salesforce’s DataLoader, allowing automated bulk exports.
    3. Anonymity layers – Mullvad VPN‑initiated calls followed by TOR‑based data exfiltration, which anonymized the actors’ true location.

    Though Google confirmed that no user passwords were stolen, the breached dataset, included business names, email addresses, phone numbers and related notes. The implications reach far beyond the affected small and medium business customers: while associating compliance, brand integrity, partner security, and regulatory scrutiny of SaaS risk management practices.

    Meanwhile, the Salesloft Drift attack orchestrated by UNC6395 has emerged as one of the most significant cyber incidents in late 2025, which compromised the Salesloft Drift (AI chat-bot/assistant) used for its Salesforce integration. The theft of OAuth token appears to have resulted in running SOQL queries on Salesforce databases that held objects such as cases, accounts, users and opportunities. The attack affected hundreds of Salesforce customers, impacting not just Salesforce users but also other third-party integrations. Salesloft said “Initial findings have shown that the actor’s primary objective was to steal credentials, specifically focusing on sensitive information like AWS access keys, passwords and Snowflake-related access tokens”. Google explicitly warned of the breach’s extensive scope beyond its own systems.

    Primary Tactics & Attack Vectors:

    • Initial Access: Unauthorized OAuth apps installed via trial accounts (using legitimate email domains) and later via compromised accounts from unrelated orgs.
    • Vishing, Social Engineering: Voice phishing calls to employees
    • Exfiltration: Custom Python scripts that replicate DataLoader operations.
      Infrastructure: Initial calls routed via Mullvad VPN IPs; data transfer via TOR exit nodes.
    • Extortion: Requesting immediate Bitcoin payment.

    Threat Attribution

    UNC5537, UNC6040 & UNC6240 likely linked with “Scattered LAPSUS$ Hunters” (“Chos hub”) exhibits similar attack patterns.

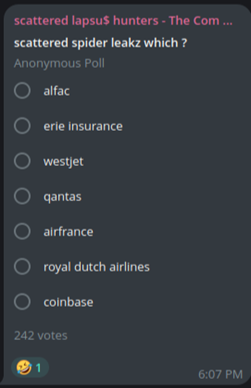
    A Telegram channel called “Scattered LAPSUS$ Hunters”, blending the names of ShinyHunters, Scattered Spider and Lapsus$ groups emerged, which researchers describe as a chaotic hub for leaks and threats. The group focuses in exploiting the human element to gain access to company networks. The channel ran public polls where members voted on which victim’s data to fully dump, advertised zero-day exploits and a supposed new ransomware toolkit, touting the collective’s action.

    GOOGLE - SALESFORCE BREACH

    UNC6395 shared the theme of abusing OAuth mechanisms for Salesforce access via compromised 3rd party integration – evolving their tactics against cloud ecosystems. Meanwhile, UNC6040 uses vishing and OAuth abuse to access Salesforce through social engineering. Overlapping TTPs indicate targeting trusted access applications and the name ShinyHunters appears across these incidents. Al the same time, Google tracks this cluster separately as UNC6395, ShinyHunters extortion group initially told BleepingComputer that they were behind the SalesLoft Drift attack.

    Parallel Campaigns

    Similar tactics applied in attacks targeting Adidas, Qantas, Allianz Life, LVMH brands (Louis Vuitton, Dior, Tiffany & Co.), Chanel, AT&T, Santander, Starbucks Singapore, Snowflake breach at Ticketmaster, Cisco, Pandora, Bouygues Telecom, Tokopedia, Homechef, Chatbooks, Portail Orange, Farmers Insurance, TransUnion, UK Legal Aid Agency, Gucci, Salesforce, Fairhaven Homes, Workday, Mazars.fr, Adidas, Air France-KLM, Phantom Wallet, Neiman Marcus, Coca-Cola, ZScaler.

    • Qantas Airways: Employee credentials & sensitive flight/customer records targeted. Attack blended SIM swapping + SaaS compromise.
    • Air France-KLM: Airline loyalty accounts and CRM cloud environment probed.
    • Retailers (generalized set) → Used social engineering and SIM-swap vishing to gain access to IT/helpdesk portals.
    • Okta: Service provider breach led to downstream impact on multiple clients (identity federation exploited).
    • MGM Resorts: Social engineering of IT desk led to ransomware deployment, slot machines & hotel services down for days.
    • Caesars Entertainment: Extortion campaign where ransom was allegedly paid; loyalty program records got leaked.
    • AT&T: Call metadata (500M+ records, including phone numbers, call/SMS logs) stolen and advertised for sale.
    • Ticketmaster (Live Nation): ~560M customer records including event ticketing details, addresses, payment info leaked.
    • Advance Auto Parts: Data set of supply chain and retail customer info stolen.
    • Santander Bank: Customer financial records compromised; reported 30M records affected.
    • LendingTree: Customer PII and loan data exposed.
    • Neiman Marcus: Customer loyalty and credit program data targeted.
    • Los Angeles Unified School District (LAUSD): Student/employee data exfiltrated from Snowflake environment.
    • Pandora, Adidas, LVMH (Louis Vuitton, Chanel, Dior): Retail brand data exposed (customer PII + sales info).
    • ZScaler: UNC6395 compromised Salesforce instance through Salesloft Drift and steals customer data


    With the attack that involves compromise of the Salesloft Drift AI OAuth token, any data that could potentially be compromised from the databases (that held information on users, accounts, cases, etc,) can be utilized by the attacker in various ways. The stolen data could either be sold to third parties or used to access emails (as reported from a very small number of Google Workspace accounts) launch further credential-reuse attacks on other SaaS accounts.

    Indicators of Compromise:

    UNC6040, UNC6240 UNC6395
    81.17.28.95

    31.133.0.210

    45.138.16.69

    45.90.185.109

    45.141.215.19

    45.90.185.115

    45.90.185.107

    37.114.50.27

    45.90.185.118

    179.43.159.201

    38.135.24.30

    91.199.42.164

    192.159.99.74

    208.68.36.90

    44.215.108.109

    154.41.95.2

    176.65.149.100

    179.43.159.198

    185.130.47.58

    185.207.107.130

    185.220.101.133

    185.220.101.143

    185.220.101.164

    185.220.101.167

    185.220.101.169

    185.220.101.180

    185.220.101.185

    185.220.101.33

    192.42.116.179

    192.42.116.20

    194.15.36.117

    195.47.238.178

    195.47.238.83

    shinycorp@tuta[.]com

    shinygroup@tuta[.]com

    shinyhuntersgroups@tutamail[.]com

    ticket-dior[.]com

    ticket-nike[.]com

    ticket-audemarspiguet[.]com

    Salesforce-Multi-Org-Fetcher/1.0

    Salesforce-CLI/1.0

    python-requests/2.32.4

    Python/3.11 aiohttp/3.12.15


    In both the campaigns Google observed TOR exit nodes being used to access compromised Salesforce accounts.

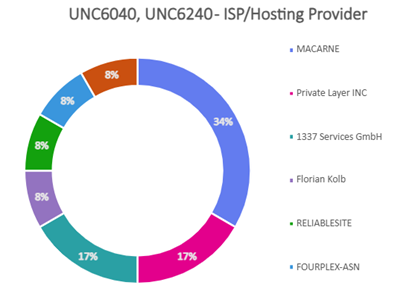
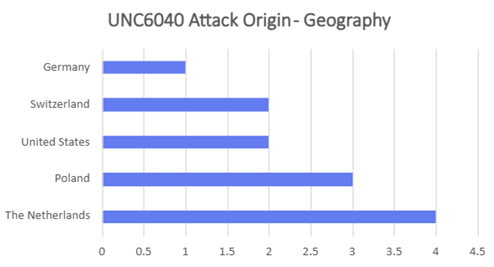
    • Majority of attacks orchestrated by UNC6040 and UNC6240 (ShinyHunters) could be traced to originate from TOR exit nodes hosted either in Netherlands or Poland. These were hosted primarily at Macarne or Private Layer INC.

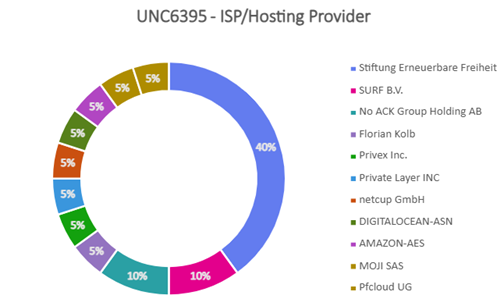
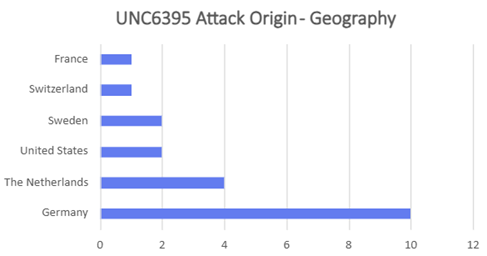
    • Attackers were found to blend TOR traffic with legitimate OAuth sessions to obscure origin and make detection harder. Attacks orchestrated by UNC6395 could be traced to originate from TOR exit nodes hosted either in Germany or Netherlands. These were hosted primarily at Stiftung Erneuerbare Freiheit.
    • Many suspicious SOQL queries (data exfiltration) and deletion of scheduled jobs were initiated from TOR IP addresses, indicating adversaries were anonymizing data theft operations.

    Similarly, Scattered Spider used TOR exit IPs as a cover for account takeovers and extortion activity.

    • Attackers combined vishing (helpdesk calls) with credential access, then routed subsequent access through Tor.
    • Tor traffic was especially noted when adversaries escalated privileges or accessed sensitive SaaS applications.
    • Europe-heavy nodes with a notable U.S. presence.

    Common Threads Across Both Campaigns

    • TOR IPs as operational cover was consistently used to hide adversary infrastructure.
    • Identity-based intrusions by both groups abused identity trust rather than exploiting zero-days.
    • Overlap with Scattered Spider tradecraft where both campaigns show attackers mixing social engineering or stolen credentials with TOR.
    • TOR exit nodes have different ASNs, but both campaigns leverage NL exit nodes. ASN 58087 (Florian Kolb, DE) overlaps across both the campaigns.

    Threat Landscape

    Threat actors such as UNC6040 (ShinyHunters-affiliated), Scattered Spider (UNC3944), and UNC5537 have targeted organizations in the hospitality, retail, and education sectors in the Americas and Europe.

    Scattered Spider (UNC3944) is known for sophistication and stealth:

    • Reliably uses commercial VPN services to mask origin: Mullvad VPN, ExpressVPN, NordVPN, Ultrasurf, Easy VPN, ZenMate.
    • Employs Tools and TTPs including disabling Antivirus/EDR, lateral movement via ADRecon, credential dumping with Mimikatz/LaZagne, and persistence via RMM and cloud VMs.

    “The Com”, short for The Community, is less a formal hacking group and more a sociopathic cybercriminal subculture:

    • Comprised of 1,000+ members and mostly aged 11–25, they operate across Canada, the U.S., and the U.K.
    • Engages in SIM swapping, cryptocurrency theft, swatting, sextortion, spear-phishing, and even extreme coercion or violence.
    • Intel471 reports that members are recruited via social media/gaming and coerced into crimes ranging from grooming to violent acts; the network has also issued a manual (“The Bible”) detailing techniques such as ATM skimming, IP grabbing, doxxing, extortion, and grooming.
    Source: DHS’s Joint Regional Intelligence Center and the Central California Intelligence Center

    UNC5537 orchestrated a large-scale breach targeting Snowflake customer environments:

    • In April–June 2024, accessed over 160 organizations including AT&T, Ticketmaster/Live Nation, Santander, Advance Auto Parts, LendingTree, Neiman Marcus, and LA Unified School District – via stolen credentials, often from infostealers, and constraints due to lack of MFA.
    • Data stolen included sensitive PII, event tickets, DEA numbers, and call/text metadata (500M+ records in aggregate).
    • Targets were later advertised and extorted through forums.

    DataBreaches.net received screenshots of a Telegram message from ShinyHunters claiming to outpace law enforcement, mocking capabilities of agencies like the NSA and stating: “Even the NSA can’t stop or identify us anymore. The FBI… is irrelevant and incompetent…”. In conversation, “Shiny” asserted that Scattered Spider sources voice calls and share access and hinted at a future “Snowflake 3.0” campaign, promising even greater operations ahead.

    Source: DataBreaches.Net

    Cross-Actor Victim Overlaps

    • Cloud SaaS as a hub: Salesforce (UNC6040), Okta (Scattered Spider), and Snowflake (UNC5537) breaches show pivot via cloud identity/data platforms.
    • Retail & hospitality: Multiple actors target customer/loyalty records
      • Scattered Spider targeted casinos.
      • UNC6040 targeted retailers.
      • UNC5537 targeted luxury brands.
    • Education: UNC6040 and UNC5537 both hit educational institutions, stealing student/faculty data.
    • Financial institutions: Santander (UNC5537) vs smaller fintech/payment targets by The Com/Scattered Spider (SIM swaps).

    Detection & Monitoring Guidance

    Additional indicators and associated detection rules for detecting the threat group is made available through STI and SMAP.

    What we recommend

    • Monitoring Logs
      Continuously scan for LOGIN events from unfamiliar IP ranges (especially Mullvad or TOR exit nodes). Flag any API activity exhibiting a high volume of requests every hour.
    • OAuth App Watch‑list
      Maintain a dynamic registry of approved apps. Trigger alerts on new or anomalous app registrations. Enforce a mandatory admin sign‑off workflow. The below detection rule is an example to detect suspicious signin events with OAuth:2.0:
      `SigninLogs | where ResultType == “0” | where AuthenticationDetails has “OAuth:2.0” | where AppDisplayName startswith “Salesforce” | summarize count() by UserPrincipalName, AppDisplayName, IPAddress | where count_ > 5`
    • Vishing Detection
      Implement caller‑ID verification, deploy voice‑analytics modules that detect key phrases (eg: “please pay”, “this is Google”) and cross‑reference against known threat‑intelligence feeds. Integrate with your call‑center platform to surface suspicious calls in real time.
    • Network Traffic Analysis
      Inspect outbound traffic for TOR exit nodes and VPN tunnels that deviate from corporate baselines. Use DPI to spot unusually large, encrypted payloads.
    • Threat‑Intelligence Feeds
      Subscribe to the latest ATT&CK and IOC updates for UNC6040/ShinyHunters. Monitor public Telegram channels for freshly disclosed IOCs.
    • Zero‑Trust IAM to reduce credential‑compromise impact
      MFA, least‑privilege, RBAC for all Salesforce users.
    • OAuth App Governance to stop rogue app installations
      Manual approval + periodic review
    • IP‑Based Restrictions to limit exfiltration paths
      Allow only corporate VPN IPs; block TOR exits
    • Endpoint Security to stop malicious code execution
      EDR to detect custom Python scripts
    • Call‑Center Hardening to mitigate human‑facing social engineering
      Caller‑ID verification, recorded scripts, staff training
    • Data Loss Prevention to detects anomalous data movements
      DLP on outbound exports (volume limits + alerts)
    • Strategic Initiative: SaaS Posture Management – continuous inventory & policy enforcement for third‑party integrations. Early rogue‑app detection is our key takeaway.
    • Revoke and rotate tokens/credentials: Immediately revoke OAuth tokens tied to Salesloft Drift and reset all exposed API keys.
    • Audit activity logs: Review SOQL queries and job deletions between Aug 8–18, 2025 for suspicious access.
    • Limit OAuth permissions: Enforce least privilege, review app scopes regularly, and tighten approval workflows.
    • Govern tokens: Ensure short-lived tokens, track their use, and revoke unused ones.
    • Secure stored credentials: Move AWS keys, Snowflake tokens, and other secrets out of Salesforce objects into vaults.
    • Enhance monitoring: Use UEBA to detect unusual SaaS behavior and consolidate logs across Salesforce, identity providers, and third-party apps.
    • Restrict integrations: Apply IP/network restrictions and remove untrusted apps until validated.

    Strategic Outlook

    • TTP Evolution – The ShinyHunters group hints at a potential pivot towards ransomware‑as‑a‑service (ShinySP1D3R).
    • Broader Targeting – High‑profile brands (Adidas, Qantas, Chanel, etc.) demonstrate that the same methodology can be scaled.
    • Regulatory Momentum – Expect stricter SaaS risk‑management mandates, amplifying the need for proactive controls.
    • Attribution Difficulty – Continued use of VPN/TOR & compromised third‑party accounts will heighten detection complexity; behavioral analytics will become indispensable.

    Final Note from Our Research Team

    The Google Salesforce breach is a textbook illustration of how modern threat actors blend technical supply‑chain exploitation with fast‑turnover social engineering. For organizations that rely on cloud‑native platforms, we see a critical need to:

    • Revisit SaaS integration policies – treat every third‑party app as a potential attack vector.
    • Strengthen human‑facing security – call‑center hardening and real‑time vishing detection should become a standard part of the security stack.
    • Adopt a data‑centric risk perspective – even smaller datasets can fuel large-scale phishing campaigns.
    • Our threat‑intelligence platform remains actively monitoring the ShinyHunters/Tor‑Mullvad threat chain and will update clients with emerging IOCs and risk indicators. We encourage you to integrate these insights into your defensive posture and to collaborate with our team for a tailored, intelligence‑driven response.

    Conclusion

    The Google internal Salesforce breach orchestrated by UNC6040 (“ShinyHunters”) underscores critical vulnerabilities in modern SaaS environments. The attack demonstrates that even data traditionally considered “low-sensitivity” can be weaponized for targeted phishing and extortion schemes, while also posing significant regulatory, reputational, operational, and financial risks. Organizations must adopt robust Identity & Access Management controls, enforce strict OAuth governance, and integrate comprehensive monitoring to mitigate evolving threats.

    The UNC6395 campaign highlights how third-party OAuth integrations can undermine SaaS security. By abusing trusted tokens, attackers bypassed MFA and exfiltrated sensitive data from hundreds of organizations. This attack reinforces SaaS ecosystems and not just core apps as prime targets. Strong governance over OAuth apps, token lifecycles, and SaaS behaviors is critical to reducing risk. Proactive monitoring, least privilege, and credential hygiene are essential to defending against token-based intrusions like this.


    Authors

    Deepak Thomas Philip

    Kartikkumar Jivani

    Sathwik Ram Prakki

    Subhajeet Singha

    Rhishav Kanjilal

    Shayak Tarafdar


    Source link

  • The First AI-Powered Ransomware & How It Works

    The First AI-Powered Ransomware & How It Works


    Introduction

    AI-powered malware has become quite a trend now. We have always been discussing how threat actors could perform attacks by leveraging AI models, and here we have a PoC demonstrating exactly that. Although it has not yet been observed in active attacks, who knows if it isn’t already being weaponized by threat actors to target organizations?

    We are talking about PromptLock, shared by ESET Research. PromptLock is the first known AI-powered ransomware. It leverages Lua scripts generated from hard-coded prompts to enumerate the local filesystem, inspect target files, exfiltrate selected data, and perform encryption. These Lua scripts are cross-platform compatible, functioning on Windows, Linux, and macOS. For file encryption, PromptLock utilizes the SPECK 128-bit encryption algorithm.

    Ransomware itself is already one of the most dangerous categories of malware. When created using AI, it becomes even more concerning. PromptLock leverages large language models (LLMs) to dynamically generate malicious scripts. These AI-generated Lua scripts drive its malicious activity, making them flexible enough to work across Windows, Linux, and macOS.

    Technical Overview:

    The malware is written in Go (Golang) and communicates with a locally hosted LLM through the Ollama API.

    On executing this malware, we will observe it to be making connection to the  locally hosted LLM through the Ollama API.

    It identifies whether the infected machine is a personal computer, server, or industrial controller. Based on this classification, PromptLock decides whether to exfiltrate, encrypt, or destroy data.

    It is not just a sophisticated sample – entire LLM prompts are in the code itself. It uses SPECK 128bit encryption algorithm in ECB mode.

    The encryption key is stored in the key variable as four 32-bit little-endian words: local key = {key[1], key[2], key[3], key[4]}. This gets dynamically generated as shown in the figure:

    It begins infection by scanning the victim’s filesystem and building an inventory of candidate files, writing the results into scan.log.

    It also scans the user’s home directory to identify files containing potentially sensitive or critical information (e.g., PII). The results are stored in target_file_list.log

    Probably, PromptLock first creates scan.log to record discovered files and then narrows this into target.log, which defines the set to encrypt. Samples also generate files like payloads.txt for metadata or staging. Once targets are set, each file is encrypted in 16-byte chunks using SPECK-128 in ECB mode, overwriting contents with ciphertext.

    After encryption, it generates ransom notes dynamically. These notes may include specific details such as a Bitcoin address (1A1zP1eP5QGefi2DMPTfTL5SLmv7DivfNa) this address is the first bitcoin address ever created and ransom amount. As it is a POC, no real data is present.

    PromptLock’s CLI and scripts rely on:

    • model=gpt-oss:20b
    • com/PeerDB-io/gluabit32
    • com/yuin/gopher-lua
    • com/gopher-lfs

    It also prints several required keys in lowercase (formatted as “key: value”), including:

    • os
    • username
    • Home
    • Hostname
    • Temp
    • Sep
    • cwd

    Implementation guidance:

    – environment variables:
    username: os.getenv(“USERNAME”) or os.getenv(“USER”)
    home: os.getenv(“USERPROFILE”) or os.getenv(“HOME”)
    hostname: os.getenv(“COMPUTERNAME”) or os.getenv(“HOSTNAME”) or io.popen(“hostname”):read(“*l”)
    temp: os.getenv(“TMPDIR”) or os.getenv(“TEMP”) or os.getenv(“TMP”) or “/tmp”
    sep: detect from package.path (if contains “\” then “\” else “/”), default to “/”


    – os: detect from environment and path separator:
    * if os.getenv(“OS”) == “Windows_NT” then “windows”
    * elseif sep == “\” then “windows”  
    * elseif os.getenv(“OSTYPE”) then use that valuevir
    * else “unix”

    – cwd: use io.popen(“pwd”):read(“*l”) or io.popen(“cd”):read(“*l”) depending on OS

    Conclusion:

    It’s high time the industry starts considering such malware cases. If we want to beat AI-powered malware, we will have to incorporate AI-powered solutions. In the last few months, we have been observing a tremendous rise in such cases, although PoCs, they are good enough to be leveraged to perform actual attacks. This clearly signals that defensive strategies must evolve at the same pace as offensive innovations.

    How Does SEQRITE Protect Its Customers?

    • PromptLock
    • PromptLock.49912.GC

    IOCs:

    • ed229f3442f2d45f6fdd4f3a4c552c1c
    • 2fdffdf0b099cc195316a85636e9636d
    • 1854a4427eef0f74d16ad555617775ff
    • 806f552041f211a35e434112a0165568
    • 74eb831b26a21d954261658c72145128
    • ac377e26c24f50b4d9aaa933d788c18c
    • F7cf07f2bf07cfc054ac909d8ae6223d


    Authors:

    Shrutirupa Banerjee
    Rayapati Lakshmi Prasanna Sai
    Pranav Pravin Hondrao
    Subhajeet Singha
    Kartikkumar Ishvarbhai Jivani
    Aravind Raj
    Rahul Kumar Mishra


    Source link

  • How to temporarily change the CurrentCulture | Code4IT

    How to temporarily change the CurrentCulture | Code4IT


    Just a second! 🫷
    If you are here, it means that you are a software developer.
    So, you know that storage, networking, and domain management have a cost .

    If you want to support this blog, please ensure that you have disabled the adblocker for this site.
    I configured Google AdSense to show as few ADS as possible – I don’t want to bother you with lots of ads, but I still need to add some to pay for the resources for my site.

    Thank you for your understanding.
    Davide

    It may happen, even just for testing some functionalities, that you want to change the Culture of the thread your application is running on.

    The current Culture is defined in this global property: Thread.CurrentThread.CurrentCulture. How can we temporarily change it?

    An idea is to create a class that implements the IDisposable interface to create a section, delimited by a using block, with the new Culture:

    public class TemporaryThreadCulture : IDisposable
    {
    	CultureInfo _oldCulture;
    
    	public TemporaryThreadCulture(CultureInfo newCulture)
    	{
    		_oldCulture = CultureInfo.CurrentCulture;
    		Thread.CurrentThread.CurrentCulture = newCulture;
    	}
    
    	public void Dispose()
    	{
    		Thread.CurrentThread.CurrentCulture = _oldCulture;
    	}
    }
    

    In the constructor, we store the current Culture in a private field. Then, when we call the Dispose method (which is implicitly called when closing the using block), we use that value to restore the original Culture.

    How to use it

    How can we try it? An example is by checking the currency symbol.

    Thread.CurrentThread.CurrentCulture = new CultureInfo("ja-jp");
    
    Console.WriteLine(Thread.CurrentThread.CurrentCulture.NumberFormat.CurrencySymbol); //¥
    
    using (new TemporaryThreadCulture(new CultureInfo("it-it")))
    {
    	Console.WriteLine(Thread.CurrentThread.CurrentCulture.NumberFormat.CurrencySymbol);//€
    }
    
    Console.WriteLine(Thread.CurrentThread.CurrentCulture.NumberFormat.CurrencySymbol); //¥
    

    We start by setting the Culture of the current thread to Japanese so that the Currency symbol is ¥. Then, we temporarily move to the Italian culture, and we print the Euro symbol. Finally, when we move outside the using block, we get back to ¥.

    Here’s a test that demonstrates the usage:

    [Fact]
    void TestChangeOfCurrency()
    {
    	using (new TemporaryThreadCulture(new CultureInfo("it-it")))
    	{
    		var euro = CultureInfo.CurrentCulture.NumberFormat.CurrencySymbol;
    		Assert.Equal(euro, "€");
    
    		using (new TemporaryThreadCulture(new CultureInfo("en-us")))
    		{
    			var dollar = CultureInfo.CurrentCulture.NumberFormat.CurrencySymbol;
    
    			Assert.NotEqual(euro, dollar);
    		}
    		Assert.Equal(euro, "€");
    	}
    }
    

    This article first appeared on Code4IT

    Conclusion

    Using a class that implements IDisposable is a good way to create a temporary environment with different characteristics than the main environment.

    I use this approach a lot when I want to experiment with different cultures to understand how the code behaves when I’m not using English (or, more generically, Western) culture.

    Do you have any other approaches for reaching the same goal? If so, feel free to share them in the comments section!

    Happy coding!

    🐧


    Source link

  • Use Debug-Assert to break the debugging flow if a condition fails | Code4IT

    Use Debug-Assert to break the debugging flow if a condition fails | Code4IT


    It would be great if we could break the debugging flow if a condition is (not) met. Can we? Of course!

    Table of Contents


    Source link

  • How to access the HttpContext in .NET API

    How to access the HttpContext in .NET API


    If your application is exposed on the Web, I guess that you get some values from the HTTP Requests, don’t you?

    Table of Contents

    Just a second! 🫷
    If you are here, it means that you are a software developer.
    So, you know that storage, networking, and domain management have a cost .

    If you want to support this blog, please ensure that you have disabled the adblocker for this site.
    I configured Google AdSense to show as few ADS as possible – I don’t want to bother you with lots of ads, but I still need to add some to pay for the resources for my site.

    Thank you for your understanding.
    Davide

    If you are building an application that is exposed on the Web, you will probably need to read some data from the current HTTP Request or set some values on the HTTP Response.

    In a .NET API, all the info related to both HTTP Request and HTTP Response is stored in a global object called HttpContext. How can you access it?

    In this article, we will learn how to get rid of the old HttpContext.Current and what we can do to write more testable code.

    Why not HttpContext directly

    Years ago, we used to access the HttpContext directly in our code.

    For example, if we had to access the Cookies collection, we used to do

    var cookies = HttpContext.Current.Request.Cookies;
    

    It worked, right. But this approach has a big problem: it makes our tests hard to set up.

    In fact, we were using a static instance that added a direct dependency between the client class and the HttpContext.

    That’s why the .NET team has decided to abstract the retrieval of that class: we now need to use IHttpContextAccessor.

    Add IHttpContextAccessor

    Now, I have this .NET project that exposes an endpoint, /WeatherForecast, that returns the current weather for a particular city, whose name is stored in the HTTP Header “data-location”.

    The real calculation (well, real… everything’s fake, here 😅) is done by the WeatherService. In particular, by the GetCurrentWeather method.

    public WeatherForecast GetCurrentWeather()
    {
        string currentLocation = GetLocationFromContext();
    
        var rng = new Random();
    
        return new WeatherForecast
        {
            TemperatureC = rng.Next(-20, 55),
            Summary = Summaries[rng.Next(Summaries.Length)],
            Location = currentLocation
        };
    }
    

    We have to retrieve the current location.

    As we said, we cannot anymore rely on the old HttpContext.Current.Request.

    Instead, we need to inject IHttpContextAccessor in the constructor, and use it to access the Request object:

    public WeatherService(IHttpContextAccessor httpContextAccessor)
    {
        _httpContextAccessor = httpContextAccessor;
    }
    

    Once we have the instance of IHttpContextAccessor, we can use it to retrieve the info from the current HttpContext headers:

    string currentLocation = "";
    
    if (_httpContextAccessor.HttpContext.Request.Headers.TryGetValue("data-location", out StringValues locationHeaders) && locationHeaders.Any())
    {
        currentLocation = locationHeaders.First();
    }
    
    return currentLocation;
    

    Easy, right? We’re almost done.

    Configure Startup class

    If you run the application in this way, you will not be able to access the current HTTP request.

    That’s because we haven’t specified that we want to add IHttpContextAccessor as a service in our application.

    To do that, we have to update the ConfigureServices class by adding this instruction:

    services.AddHttpContextAccessor();
    

    Which comes from the Microsoft.Extensions.DependencyInjection namespace.

    Now we can run the project!

    If we call the endpoint specifying a City in the data-location header, we will see its value in the returned WeatherForecast object, in the Location field:

    Location is taken from the HTTP Headers

    Further improvements

    Is it enough?

    Is it really enough?

    If we use it this way, every class that needs to access the HTTP Context will have tests quite difficult to set up, because you will need to mock several objects.

    In fact, for mocking HttpContext.Request.Headers, we need to create mocks for HttpContext, for Request, and for Headers.

    This makes our tests harder to write and understand.

    So, my suggestion is to wrap the HttpContext access in a separate class and expose only the methods you actually need.

    For instance, you could wrap the access to HTTP Request Headers in the GetValueFromRequestHeader of an IHttpContextWrapper service:

    public interface IHttpContextWrapper
    {
        string GetValueFromRequestHeader(string key, string defaultValue);
    }
    

    That will be the only service that accesses the IHttpContextAccessor instance.

    public class HttpContextWrapper : IHttpContextWrapper
    {
        private readonly IHttpContextAccessor _httpContextAccessor;
    
        public HttpContextWrapper(IHttpContextAccessor httpContextAccessor)
        {
            _httpContextAccessor = httpContextAccessor;
        }
    
        public string GetValueFromRequestHeader(string key, string defaultValue)
        {
            if (_httpContextAccessor.HttpContext.Request.Headers.TryGetValue(key, out StringValues headerValues) && headerValues.Any())
            {
                return headerValues.First();
            }
    
            return defaultValue;
        }
    }
    

    In this way, you will be able to write better tests both for the HttpContextWrapper class, by focusing on the building of the HttpRequest, and for the WeatherService class, so that you can write tests without worrying about setting up complex structures just for retrieving a value.

    But pay attention to the dependency lifescope! HTTP Requests info live within – guess what? – their HTTP Request. So, when defining the dependencies in the Startup class, remember to inject the IHttpContextWrapper as Transient or, even better, as Scoped. If you don’t remember the difference, I got you covered here!

    Wrapping up

    In this article, we’ve learned that you can access the current HTTP request by using IHttpContextAccessor. Of course, you can use it to update the Response too, for instance by adding an HTTP Header.

    Happy coding!

    🐧


    Source link

  • Closing the Compliance Gap with Data Discovery

    Closing the Compliance Gap with Data Discovery


    In today’s regulatory climate, compliance is no longer a box-ticking exercise. It is a strategic necessity. Organizations across industries are under pressure to secure sensitive data, meet privacy obligations, and avoid hefty penalties. Yet, despite all the talk about “data visibility” and “compliance readiness,” one fundamental gap remains: unseen data—the information your business holds but doesn’t know about.

    Unseen data isn’t just a blind spot—it’s a compliance time bomb waiting to trigger regulatory and reputational damage.

    The Myth: Sensitive Data Lives Only in Databases

    Many businesses operate under the dangerous assumption that sensitive information exists only in structured repositories like databases, ERP platforms, or CRM systems. While it’s true these systems hold vast amounts of personal and financial information, they’re far from the whole picture.

    Reality check: Sensitive data is often scattered across endpoints, collaboration platforms, and forgotten storage locations. Think of HR documents on a laptop, customer details in a shared folder, or financial reports in someone’s email archive. These are prime targets for breaches—and they often escape compliance audits because they live outside the “official” data sources.

    Myth vs Reality: Why Structured Data is Not the Whole Story

    Yes, structured sources like SQL databases allow centralized access control and auditing. But compliance risks aren’t limited to structured data. Unstructured and endpoint data can be far more dangerous because:

    • They are harder to track.
    • They often bypass IT policies.
    • They get replicated in multiple places without oversight.

    When organizations focus solely on structured data, they risk overlooking up to 50–70% of their sensitive information footprint.

    The Challenge Without Complete Discovery

    Without full-spectrum data discovery—covering structured, unstructured, and endpoint environments—organizations face several challenges:

    1. Compliance Gaps – Regulations like GDPR, DPDPA, HIPAA, and CCPA require knowing all locations of personal data. If data is missed, compliance reports will be incomplete.
    2. Increased Breach Risk – Cybercriminals exploit the easiest entry points, often targeting endpoints and poorly secured file shares.
    3. Inefficient Remediation – Without knowing where data lives, security teams can’t effectively remove, encrypt, or mask it.
    4. Costly Investigations – Post-breach forensics becomes slower and more expensive when data locations are unknown.

    The Importance of Discovering Data Everywhere

    A truly compliant organization knows where every piece of sensitive data resides, no matter the format or location. That means extending discovery capabilities to:

    1. Structured Data
    • Where it lives: Databases, ERP, CRM, and transactional systems.
    • Why it matters: It holds core business-critical records, such as customer PII, payment data, and medical records.
    • Risks if ignored: Non-compliance with data subject rights requests; inaccurate reporting.
    1. Unstructured Data
    • Where it lives: File servers, SharePoint, Teams, Slack, email archives, cloud storage.
    • Why it matters: Contains contracts, scanned IDs, reports, and sensitive documents in freeform formats.
    • Risks if ignored: Harder to monitor, control, and protect due to scattered storage.
    1. Endpoint Data
    • Where it lives: Laptops, desktops, mobile devices (Windows, Mac, Linux).
    • Why it matters: Employees often store working copies of sensitive files locally.
    • Risks if ignored: Theft, loss, or compromise of devices can expose critical information.

    Real-World Examples of Compliance Risks from Unseen Data

    1. Healthcare Sector: A hospital’s breach investigation revealed patient records stored on a doctor’s laptop, which was never logged into official systems. GDPR fines followed.
    2. Banking & Finance: An audit found loan application forms with customer PII on a shared drive, accessible to interns.
    3. Retail: During a PCI DSS assessment, old CSV exports containing cardholder data were discovered in an unused cloud folder.
    4. Government: Sensitive citizen records are emailed between departments, bypassing secure document transfer systems, and are later exposed to a phishing attack.

    Closing the Gap: A Proactive Approach to Data Discovery

    The only way to eliminate unseen data risks is to deploy comprehensive data discovery and classification tools that scan across servers, cloud platforms, and endpoints—automatically detecting sensitive content wherever it resides.

    This proactive approach supports regulatory compliance, improves breach resilience, reduces audit stress, and ensures that data governance policies are meaningful in practice, not just on paper.

    Bottom Line

    Compliance isn’t just about protecting data you know exists—it’s about uncovering the data you don’t. From servers to endpoints, organizations need end-to-end visibility to safeguard against unseen risks and meet today’s stringent data protection laws.

    Seqrite empowers organizations to achieve full-spectrum data visibility — from servers to endpoints — ensuring compliance and reducing risk. Learn how we can help you discover what matters most.


    Source link

  • 3 ways to check the object passed to mocks with Moq in C# | Code4IT

    3 ways to check the object passed to mocks with Moq in C# | Code4IT


    In unit tests, sometimes you need to perform deep checks on the object passed to the mocked service. We will learn 3 ways to do that with Moq and C#

    Table of Contents

    Just a second! 🫷
    If you are here, it means that you are a software developer.
    So, you know that storage, networking, and domain management have a cost .

    If you want to support this blog, please ensure that you have disabled the adblocker for this site.
    I configured Google AdSense to show as few ADS as possible – I don’t want to bother you with lots of ads, but I still need to add some to pay for the resources for my site.

    Thank you for your understanding.
    Davide

    When writing unit tests, you can use Mocks to simulate the usage of class dependencies.

    Even though some developers are harshly against the usage of mocks, they can be useful, especially when the mocked operation does not return any value, but still, you want to check that you’ve called a specific method with the correct values.

    In this article, we will learn 3 ways to check the values passed to the mocks when using Moq in our C# Unit Tests.

    To better explain those 3 ways, I created this method:

    public void UpdateUser(User user, Preference preference)
    {
        var userDto = new UserDto
        {
            Id = user.id,
            UserName = user.username,
            LikesBeer = preference.likesBeer,
            LikesCoke = preference.likesCoke,
            LikesPizza = preference.likesPizza,
        };
    
        _userRepository.Update(userDto);
    }
    

    UpdateUser simply accepts two objects, user and preference, combines them into a single UserDto object, and then calls the Update method of _userRepository, which is an interface injected in the class constructor.

    As you can see, we are not interested in the return value from _userRepository.Update. Rather, we are interested in checking that we are calling it with the right values.

    We can do it in 3 ways.

    Verify each property with It.Is

    The simplest, most common way is by using It.Is<T> within the Verify method.

    [Test]
    public void VerifyEachProperty()
    {
        // Arrange
        var user = new User(1, "Davide");
        var preferences = new Preference(true, true, false);
    
        UserDto expected = new UserDto
        {
            Id = 1,
            UserName = "Davide",
            LikesBeer = true,
            LikesCoke = false,
            LikesPizza = true,
        };
    
        //Act
    
        userUpdater.UpdateUser(user, preferences);
    
        //Assert
        userRepo.Verify(_ => _.Update(It.Is<UserDto>(u =>
            u.Id == expected.Id
            && u.UserName == expected.UserName
            && u.LikesPizza == expected.LikesPizza
            && u.LikesBeer == expected.LikesBeer
            && u.LikesCoke == expected.LikesCoke
        )));
    }
    

    In the example above, we used It.Is<UserDto> to check the exact item that was passed to the Update method of userRepo.

    Notice that it accepts a parameter. That parameter is of type Func<UserDto, bool>, and you can use it to define when your expectations are met.

    In this particular case, we’ve checked each and every property within that function:

    u =>
        u.Id == expected.Id
        && u.UserName == expected.UserName
        && u.LikesPizza == expected.LikesPizza
        && u.LikesBeer == expected.LikesBeer
        && u.LikesCoke == expected.LikesCoke
    

    This approach works well when you have to perform checks on only a few fields. But the more fields you add, the longer and messier that code becomes.

    Also, a problem with this approach is that if it fails, it becomes hard to understand which is the cause of the failure, because there is no indication of the specific field that did not match the expectations.

    Here’s an example of an error message:

    Expected invocation on the mock at least once, but was never performed: _ => _.Update(It.Is<UserDto>(u => (((u.Id == 1 && u.UserName == "Davidde") && u.LikesPizza == True) && u.LikesBeer == True) && u.LikesCoke == False))
    
    Performed invocations:
    
    Mock<IUserRepository:1> (_):
        IUserRepository.Update(UserDto { UserName = Davide, Id = 1, LikesPizza = True, LikesCoke = False, LikesBeer = True })
    

    Can you spot the error? And what if you were checking 15 fields instead of 5?

    Verify with external function

    Another approach is by externalizing the function.

    [Test]
    public void WithExternalFunction()
    {
        //Arrange
        var user = new User(1, "Davide");
        var preferences = new Preference(true, true, false);
    
        UserDto expected = new UserDto
        {
            Id = 1,
            UserName = "Davide",
            LikesBeer = true,
            LikesCoke = false,
            LikesPizza = true,
        };
    
        //Act
        userUpdater.UpdateUser(user, preferences);
    
        //Assert
        userRepo.Verify(_ => _.Update(It.Is<UserDto>(u => AreEqual(u, expected))));
    }
    
    private bool AreEqual(UserDto u, UserDto expected)
    {
        Assert.AreEqual(expected.UserName, u.UserName);
        Assert.AreEqual(expected.Id, u.Id);
        Assert.AreEqual(expected.LikesBeer, u.LikesBeer);
        Assert.AreEqual(expected.LikesCoke, u.LikesCoke);
        Assert.AreEqual(expected.LikesPizza, u.LikesPizza);
    
        return true;
    }
    

    Here, we are passing an external function to the It.Is<T> method.

    This approach allows us to define more explicit and comprehensive checks.

    The good parts of it are that you will gain more control over the assertions, and you will also have better error messages in case a test fails:

    Expected string length 6 but was 7. Strings differ at index 5.
    Expected: "Davide"
    But was:  "Davidde"
    

    The bad part is that you will stuff your test class with lots of different methods, and the class can easily become hard to maintain. Unluckily, we cannot use local functions.

    On the other hand, having external functions allows us to combine them when we need to do some tests that can be reused across test cases.

    Intercepting the function parameters with Callback

    Lastly, we can use a hidden gem of Moq: Callbacks.

    With Callbacks, you can store in a local variable the reference to the item that was called by the method.

    [Test]
    public void CompareWithCallback()
    {
        // Arrange
    
        var user = new User(1, "Davide");
        var preferences = new Preference(true, true, false);
    
        UserDto actual = null;
        userRepo.Setup(_ => _.Update(It.IsAny<UserDto>()))
            .Callback(new InvocationAction(i => actual = (UserDto)i.Arguments[0]));
    
        UserDto expected = new UserDto
        {
            Id = 1,
            UserName = "Davide",
            LikesBeer = true,
            LikesCoke = false,
            LikesPizza = true,
        };
    
        //Act
        userUpdater.UpdateUser(user, preferences);
    
        //Assert
        Assert.IsTrue(AreEqual(expected, actual));
    }
    

    In this way, you can use it locally and run assertions directly to that object without relying on the Verify method.

    Or, if you use records, you can use the auto-equality checks to simplify the Verify method as I did in the previous example.

    Wrapping up

    In this article, we’ve explored 3 ways to perform checks on the objects passed to dependencies mocked with Moq.

    Each way has its pros and cons, and it’s up to you to choose the approach that fits you the best.

    I personally prefer the second and third approaches, as they allow me to perform better checks on the passed values.

    What about you?

    For now, happy coding!

    🐧


    Source link

  • Setting the Stage: Inside the Process of Bringing Christian Fleming’s Work to Life in Print, Web, and 3D

    Setting the Stage: Inside the Process of Bringing Christian Fleming’s Work to Life in Print, Web, and 3D


    When two creatives collaborate, the design process becomes a shared stage — each bringing their own strengths, perspectives, and instincts. This project united designer/art director Artem Shcherban and 3D/motion designer Andrew Moskvin to help New York–based scenographer and costume designer Christian Fleming completely reimagine how his work is presented.

    What began as a portfolio refresh evolved into a cohesive visual system: a rigorously minimal print catalog, a single-page website concept, and a cinematic 3D visualization. Together, Artem and Andrew shaped an experience that distilled Christian’s theatrical sensibility into clear, atmospheric design across both physical and digital formats.

    From here, Artem picks up the story, walking us through how he approached the portfolio’s structure, the visual rules it would live by, and the thinking that shaped both its print and on-screen presence.

    Starting the Design Conversation

    Christian Fleming is a prominent designer and director based in New York City who works with theaters around the world creating visual spaces for performances. He approached me with a challenge: to update and rethink his portfolio, to make it easy to send out to theater directors and curators. Specifically the print format.

    Christian had a pretty clear understanding of what he wanted to show and how it should look: rigid Scandinavian minimalism, extreme clarity of composition, a minimum of elements and a presentation that would be understandable to absolutely anyone – regardless of age, profession or context.

    It was important to create a system that would:

    • be updated regularly (approximately every 3 weeks),
    • adapt to new projects,
    • and at the same time remain visually and semantically stable.

    There also needed to be an “About Christian” section in the structure, but this too had to fit within a strict framework of visual language.

    Designing a Flexible Visual System

    I started by carefully analyzing how Christian works. His primary language is visual. He thinks in images, light, texture and composition. So it was important to retain a sense of air and rhythm, but build a clear modular structure that he could confidently work with on his own.

    We came up with a simple adaptive system:

    • it easily adapts to images of different formats,
    • scalable for everything from PDFs to presentations,
    • and can be used both digitally and offline.

    In the first stages, we tried several structures. However, Christian still felt that there was something missing in the layout – the visuals and logic were in conflict. We discussed which designs he wanted to show openly and which he didn’t. Some works had global reviews and important weight, but could not be shown in all details.

    The solution was to divide them into two meaningful blocks:

    “Selected Projects”, with full submission, and “Archival Projects”, with a focus on awards, reviews, and context. This approach preserved both structure and tone. The layout became balanced – and Christian immediately responded to this.

    After gathering the structure and understanding how it would work, we began creating the design itself and populating it with content. It was important from the start to train Kristan to add content on his own, as there was a lot of project and they change quite often.

    One of the key pluses of our work is versatility. Not only could the final file be emailed, but it could also be used as a print publication. This gave Christian the opportunity to give physical copies at meetings, premieres and professional events where tactility and attention to detail are important.

    Christian liked the first result, both in the way the system was laid out and the way I approached the task. Then I suggested: let’s update the website as well.

    Translating the Portfolio to a Single-Page Site

    This phase proved to be the most interesting, and the most challenging.

    Although the website looks simple, it took almost 3 months to build. From the very beginning, Christian and I tried to understand why he needed to update the site and how it should work together with the already established portfolio system.

    The main challenge was to show the visual side of his projects. Not just text or logos, but the atmosphere, the light, the costumes, the feeling of the scene.

    One of the restrictions that Christian set was the requirement to make the site as concise as possible, without a large number of pages, or better to limit it to one, and without unnecessary transitions. It had to be simple, clear and intuitive, but still user-friendly and quite informative. This was a real challenge, given the amount of content that needed to be posted.

    Designing with Stage Logic

    One of the key constraints that started the work on the site was Christian’s wish: no multiple pages. Everything had to be compact, coherent, clear and yet rich. This posed a special challenge. It was necessary to accommodate a fairly large amount of information without overloading the perception.

    I proposed a solution built on a theatrical metaphor: as in a stage blackout, the screen darkens and a new space appears. Each project becomes its own scene, with the user as a spectator — never leaving their seat, never clicking through menus. Navigation flows in smooth, seamless transitions, keeping attention focused and the emotional rhythm intact.

    Christian liked the idea, but immediately faced a new challenge: how to fit everything important on one screen:

    • a short text about him,
    • social media links and a resume,
    • the job title and description,
    • and, if necessary, reviews.

    At the same time, the main visual content – photos and videos – had to remain in the center of attention and not overlap with the interface.

    Solving the Composition Puzzle

    We explored several layouts — from centered titles and multi-level disclosures to diagonal structures and thumbnail navigation. Some looked promising, but they lacked the sense of theatrical rhythm we wanted. The layouts felt crowded, with too much design and not enough air.

    The breakthrough came when we shifted focus from pure visuals to structural logic. We reduced each project view to four key elements: minimal information about Christian, the production title with the director’s name, a review (when available), and a button to select the project. Giving each element its own space created a layout that was both clear and flexible, without overloading the screen.

    Refining Through Iteration

    As with the book, the site went through several iterations:

    • In the first prototype, the central layout quickly proved unworkable – long play titles and director names didn’t fit on the screen, especially in the mobile version. We were losing scalability and not using all the available space.
    • In the second version, we moved the information blocks upwards – this gave us a logical hierarchy and allowed us not to burden the center of the screen. The visual focus remained on the photos, and the text did not interfere with the perception of the scenography.
    • In the third round, the idea of “titles” appeared – a clear typographic structure, where titles are highlighted only by boldness, without changing the lettering. This was in keeping with the overall minimalist aesthetic, and Christian specifically mentioned that he didn’t want to use more than one font or style unless necessary.

    We also decided to stylistically separate the reviews from the main description. We italicized them and put them just below. This made it clear what belonged to the author and what was a response to the author’s work.

    Bringing Theatrical Flow to Navigation

    The last open issue was navigation between projects. I proposed two scenarios:

    1. Navigating with arrows, as if the viewer were leafing through the play scene by scene.
    2. A clickable menu with a list of works for those who want to go directly.

    Christian was concerned about the question: wouldn’t the user lose their bearings if they didn’t see the list all the time? We discussed this and came to the conclusion that most visitors don’t come to the site to “look for the right job”. They come to feel the atmosphere and “experience” its theater. So the basic scenario is a consistent browsing experience, like moving through a play. The menu is available, but not in the way – it should not break the effect of involvement.

    What We Learned About Theatrical Design

    We didn’t build just a website. We built an experience. It is not a digital storefront, but a space that reflects the way Christian works. He is an artist who thinks in the rhythm of the stage, and it was essential not to break that rhythm.

    The result is a place where the viewer isn’t distracted; they inhabit it. Navigation, structure, and interface quietly support this experience. Much of that comes from Christian’s clear and thoughtful feedback, which shaped the process at every step. This project is a reminder that even work which appears simple is defined by countless small decisions, each influencing not only how it functions but also the mood it creates from the very beginning.

    Extending the Design from Screen to Print

    Once the site was complete, a new question emerged: how should this work be presented in the most meaningful way?

    The digital format was only part of the answer. We also envisioned a printed edition — something that could be mailed or handed over in person as a physical object. In the theater world, where visual presence and tactility carry as much weight as the idea itself, this felt essential.

    We developed a set of layouts, but bringing the catalog to life as intended proved slow. Christian’s schedule with his theater work left little time to finalize the print production. We needed an alternative that could convey not only the design but also the atmosphere and weight of the finished book.

    Turning the Book into a Cinematic Object

    At this stage, 3D and motion designer Andrew Moskvin joined the project. We shared the brief with him — not just to present the catalog, but to embed it within the theatrical aesthetic, preserving the play of light, texture, air, and mood that defined the website.

    Andrew was immediately enthusiastic. After a quick call, he dove into the process. I assembled all the pages of the print version we had, and together we discussed storyboards, perspectives, atmosphere, possible scenes, and materials that could deepen the experience. The goal was more than simply showing the layout — we wanted cinematic shots where every fold of fabric and every spot of light served a single dramaturgy.

    The result exceeded expectations. Andrew didn’t just recreate the printed version; he brought it to life. His work was subtle and precise, with a deep respect for context. He captured not only the mood but also the intent behind each spread, giving the book weight, materiality, and presence — the kind we imagined holding in our hands and leafing through in person.

    Andrew will share his development process below.

    Breaking Down the 3D Process

    The Concept

    At the very start, I wanted my work to blend fluently in the ideas that were already made. Christian Fleming is a scenographer and costume designer, so the visual system needed to reflect his world. Since the project was deeply rooted in the theatrical aesthetic, my 3D work had to naturally blend into that atmosphere. Artem’s direction played a key role in shaping the unique look envisioned by Christian Fleming — rich with stage-like presence, bold compositions, and intentional use of space. My task was to ensure that the 3D elements not only supported this world, but also felt like an organic extension of it — capturing the same mood, lighting nuances, and visual rhythm that define a theatrical setting.

    The Tools

    For the entire 3D pipeline, I worked in:

    1. Cinema 4D for modeling and scene setup
    2. Redshift for rendering 
    3. After Effects for compositing 
    4. Photoshop for color correcting static images

    Modeling the Book

    The book was modeled entirely from scratch. Me and Artem discussed the form and proportions, and after several iterations, we finalized the design direction. I focused on the small details that bring realism: the curvature of the hardcover spine, beveled edges, the separation between the cover and pages, and the layered structure of the paper block. I also modeled the cloth texture wrapping the spine, giving the book a tactile, fabric-like look. The geometry was built to hold up in close-up shots and fit the theatrical lighting.

    Lighting with a Theatrical Eye

    Lighting was one of the most important parts of this process. I wanted the scenes to feel theatrical — as if the objects were placed on a stage under carefully controlled spotlights. Using a combination of area lights and spotlights in Redshift, I shaped the lighting to create soft gradients and shadows on the surfaces. The setup was designed to emphasize the geometry without flattening it, always preserving depth and direction. A subtle backlight highlight played a key role in defining the edges and enhancing the overall form.

    I think I spent more time on lighting than on modeling, since lighting has always been more experimental for me — even in product scenes.

    One small but impactful trick I always use is setting up a separate HDRI map just for reflections. I disable its contribution to diffuse lighting by setting the diffuse value to 0, while keeping reflections at 1. This allows the reflections to pop more without affecting the overall lighting of the scene. It’s a simple setup, but it gives you way more control over how materials respond — especially in stylized or highly art-directed environments.

    Building the Materials

    When I was creating the materials, I noticed that Artem had used a checkerboard texture for the cover. So I thought — why not take that idea further and implement it directly into the material? I added a subtle bump using a checker texture on the sides and front part of the book.

    I also experimented quite a bit with displacement. Initially, I had the idea to make the title metallic, but it felt too predictable. So instead, I went with a white title featuring embossed details, while keeping the checker bump texture underneath.

    This actually ties back to the modeling process — for the displacement to work properly, the geometry had to be evenly dense and ready for subdivision. 

    I created a mask in Photoshop and applied a procedural Gaussian blur using a Smart Object. Without the blur, the displacement looked harsh and unrefined — even a slight blur made a noticeable difference.

    The main challenge with using white, as always, was avoiding blown-out highlights. I had to carefully balance the lighting and tweak the material settings to make the title clean and visible without overexposing it.

    One of the more unusual challenges in this project was animating the page slide and making the pages differ. I didn’t want the pages to feel too repetitive, but I also didn’t want to create dozens of individual materials for each page. To find a balance, I created two different materials for two pages and made them random inside of the cloner. It was a bit of a workaround — mostly due to limitations inside the Shader switch node — but it worked well enough to create the illusion of variety without significantly increasing the complexity of the setup.

    There’s a really useful node in Redshift called Color User Data — especially when working with the MoGraph system to trigger object index values. One of the strangest (and probably least intuitive) things I did in this setup was using a Change Range node to remap those index values properly according to the number of textures I had. With that in place, I built a system that used an index to mix between all the textures inside a Shader Switch node. This allowed me to get true variation across the pages without manually assigning materials to each one.

    You might’ve noticed that the pages look a bit too bright for a real-world scenario — and that was actually a deliberate choice. I often use a trick that helps me art-direct material brightness independently of the scene’s lighting. The key node here is Color Correct Node.

    Inside it, there’s a parameter called Level. If you set it higher than 1, it increases the overall brightness of the texture output — without affecting shadows or highlights too aggressively. This also works in reverse: if your texture has areas that are too bright (like pure white), lowering the Level value below 1 will tone it down without needing to modify the source texture.

    It’s a simple trick, but incredibly useful when you want fine control over how materials react in stylized or theatrical lighting setups.

    The red cloth material I used throughout the scene is another interesting part of the project. I wanted it to have a strong tactile feel — something that looks thick, textured, and physically present. To achieve that, I relied heavily on geometry. I used a Redshift Object Tag with Subdivision (under the Geometry tab) enabled to add more detail where it was needed. This helped the cloth catch light properly and hold up in close-up shots.

    For the translucent look, I originally experimented with Subsurface Scattering, but it didn’t give me the control I wanted. So instead, I used an Opacity setup driven by a Ramp and Change Range nodes. That gave me just enough falloff and variation to fake the look of light passing through thinner areas of the fabric — and in the end, it worked surprisingly well.

    Animating the Pages

    This was by far the most experimental part of the project for me. The amount of improvisation — and the complete lack of confidence in what the next frame would be — made the process both fun and flexible.

    What you’re about to see might look a bit chaotic, so let me quickly walk you through how it all started.

    The simulation started with a subject — in our case, a page. It had to have the proper form, and by that I mean the right typology. Specifically, it needed to consist only of horizontal segments; otherwise, it would bend unevenly under the forces present in the scene. (And yes, I did try versions with even polygons — it got messy.)

    I set up all the pages in a Cloner so I could easily adjust any parameters I needed, and added a bit of randomness using a Random Effector.

    In the video, you can see a plane on the side that connects to the pages — that was actually the first idea I had when thinking about how to run the simulation. The plane has a Connect tag that links all the pages to it, so when it rotates, they all follow along.

    I won’t go into all the force settings — most of them were experimental, and animations like this always require a bit of creative adjustment.

    The main force was wind. The pages did want to slide just from the plane with the Connect tag, but I needed to give them an extra push from underneath — that’s where wind came in handy.

    I also used a Field Force to move the pages mid-air, from the center outward to the other side.

    Probably the most important part was how I triggered the “Mix Animation.” I used a Vertex Map tag on the Cloner to paint a map using a Field, which then drove the Mix Animation parameter in the Cloth tag. This setup made the pages activate one by one, creating a natural, finger-like sliding motion as seen in Video.

    Postprocessing

    I didn’t go too heavy on post-processing, but there’s one plugin I have to mention — Deep Glow. It gives amazing results. By tweaking the threshold, you can make it react only to the brightest areas, which creates a super clean, glowing effect.

    The Final Theatrical Ecosystem

    In the end, Christian was delighted with the outcome. Together we had built more than a portfolio — we had created a cohesive theatrical ecosystem. It moved fluidly from digital performance to printed object, from live stage to interface, and from emotion to technology.

    The experience is pared back to its essence: no superfluous effects, no unnecessary clicks, nothing to pull focus. What remains is what matters most — the work itself, framed in a way that stays quietly behind the scenes yet comes fully alive in the viewer’s hands and on their screen.


    Source link

  • How to Choose the Top XDR Vendor for Your Cybersecurity Future

    How to Choose the Top XDR Vendor for Your Cybersecurity Future


    Cyberattacks aren’t slowing down—they’re getting bolder and smarter. From phishing scams to ransomware outbreaks, the number of incidents has doubled or even tripled year over year. In today’s hybrid, multi-vendor IT landscape, protecting your organization’s digital assets requires choosing the top XDR vendor that can see and stop threats across every possible entry point.

    Over the last five years, XDR (Extended Detection and Response) has emerged as one of the most promising cybersecurity innovations. Leading IT analysts agree: XDR solutions will play a central role in the future of cyber defense. But not all XDR platforms are created equal. Success depends on how well an XDR vendor integrates Endpoint Protection Platforms (EPP) and Endpoint Detection and Response (EDR) to detect, analyze, and neutralize threats in real time.

    This guide will explain what makes a great XDR vendor and how Seqrite XDR compares to industry benchmarks. It also includes a practical checklist for confidently evaluating your next security investment.

    Why Choosing the Right XDR Vendor Matters

    Your XDR platform isn’t just another security tool; it’s the nerve center of your threat detection and response strategy. The best solutions act as a central brain, collecting security telemetry from:

    • Endpoints
    • Networks
    • Firewalls
    • Email
    • Identity systems
    • DNS

    They don’t just collect this data, they correlate it intelligently, filter out the noise, and give your security team actionable insights to respond faster.

    According to industry reports, over 80% of IT and cybersecurity professionals are increasing budgets for threat detection and response. If you choose the wrong vendor, you risk fragmented visibility, alert fatigue, and missed attacks.

    Key Capabilities Every Top XDR Vendor Should Offer

    When shortlisting top XDR vendors, here’s what to look for:

    1. Advanced Threat Detection – Identify sophisticated, multi-layer attack patterns that bypass traditional tools.
    2. Risk-Based Prioritization – Assign scores (1–1000) so you know which threats truly matter.
    3. Unified Visibility – A centralized console to eliminate security silos.
    4. Integration Flexibility – Native and third-party integrations to protect existing investments.
    5. Automation & Orchestration – Automate repetitive workflows to respond in seconds, not hours.
    6. MITRE ATT&CK Mapping – Know exactly which attacker tactics and techniques you can detect.

    Remember, it’s the integration of EPP and EDR that makes or breaks an XDR solution’s effectiveness.

    Your Unified Detection & Response Checklist

    Use this checklist to compare vendors on a like-for-like basis:

    • Full telemetry coverage: Endpoints, networks, firewalls, email, identity, and DNS.
    • Native integration strength: Smooth backend-to-frontend integration for consistent coverage.
    • Real-time threat correlation: Remove false positives, detect real attacks faster.
    • Proactive security posture: Shift from reactive to predictive threat hunting.
    • MITRE ATT&CK alignment: Validate protection capabilities against industry-recognized standards.

    Why Automation Is the Game-Changer

    The top XDR vendors go beyond detection, they optimize your entire security operation. Automated playbooks can instantly execute containment actions when a threat is detected. Intelligent alert grouping cuts down on noise, preventing analyst burnout.

    Automation isn’t just about speed; it’s about cost savings. A report by IBM Security shows that organizations with full automation save over ₹31 crore annually and detect/respond to breaches much faster than those relying on manual processes.

    The Seqrite XDR Advantage

    Seqrite XDR combines advanced detection, rich telemetry, and AI-driven automation into a single, unified platform. It offers:

    • Seamless integration with Seqrite Endpoint Protection (EPP) and Seqrite Endpoint Detection & Response (EDR) and third party telemetry sources.
    • MITRE ATT&CK-aligned visibility to stay ahead of attackers.
    • Automated playbooks to slash response times and reduce manual workload.
    • Unified console for complete visibility across your IT ecosystem.
    • GenAI-powered SIA (Seqrite Intelligent Assistant) – Your AI-Powered Virtual Security Analyst. SIA offers predefined prompts and conversational access to incident and alert data, streamlining investigations and making it faster for analysts to understand, prioritize, and respond to threats.

    In a market crowded with XDR solutions, Seqrite delivers a future-ready, AI-augmented platform designed for today’s threats and tomorrow’s unknowns.

    If you’re evaluating your next security investment, start with a vendor who understands the evolving threat landscape and backs it up with a platform built for speed, intelligence, and resilience.


    Source link

  • The 2 secret endpoints I create in my .NET APIs &vert; Code4IT

    The 2 secret endpoints I create in my .NET APIs | Code4IT


    In this article, I will show you two simple tricks that help me understand the deployment status of my .NET APIs

    Table of Contents

    Just a second! 🫷
    If you are here, it means that you are a software developer.
    So, you know that storage, networking, and domain management have a cost .

    If you want to support this blog, please ensure that you have disabled the adblocker for this site.
    I configured Google AdSense to show as few ADS as possible – I don’t want to bother you with lots of ads, but I still need to add some to pay for the resources for my site.

    Thank you for your understanding.
    Davide

    When I create Web APIs with .NET I usually add two “secret” endpoints that I can use to double-check the status of the deployment.

    I generally expose two endpoints: one that shows me some info about the current environment, and another one that lists all the application settings defined after the deployment.

    In this article, we will see how to create those two endpoints, how to update the values when building the application, and how to hide those endpoints.

    Project setup

    For this article, I will use a simple .NET 6 API project. We will use Minimal APIs, and we will use the appsettings.json file to load the application’s configuration values.

    Since we are using Minimal APIs, you will have the endpoints defined in the Main method within the Program class.

    To expose an endpoint that accepts the GET HTTP method, you can write

    endpoints.MapGet("say-hello", async context =>
    {
       await context.Response.WriteAsync("Hello, everybody!");
    });
    

    That’s all you need to know about .NET Minimal APIs for the sake of this article. Let’s move to the main topics ⏩

    How to show environment info in .NET APIs

    Let’s say that your code execution depends on the current Environment definition. Typical examples are that, if you’re running on production you may want to hide some endpoints otherwise visible in the other environments, or that you will use a different error page when an unhandled exception is thrown.

    Once the application has been deployed, how can you retrieve the info about the running environment?

    Here we go:

    app.MapGet("/env", async context =>
    {
        IWebHostEnvironment? hostEnvironment = context.RequestServices.GetRequiredService<IWebHostEnvironment>();
        var thisEnv = new
        {
            ApplicationName = hostEnvironment.ApplicationName,
            Environment = hostEnvironment.EnvironmentName,
        };
    
        var jsonSerializerOptions = new JsonSerializerOptions { WriteIndented = true };
        await context.Response.WriteAsJsonAsync(thisEnv, jsonSerializerOptions);
    });
    

    This endpoint is quite simple.

    The context variable, which is of type HttpContext, exposes some properties. Among them, the RequestServices property allows us to retrieve the services that have been injected when starting up the application. We can then use GetRequiredService to get a service by its type and store it into a variable.

    💡 GetRequiredService throws an exception if the service cannot be found. On the contrary, GetService returns null. I usually prefer GetRequiredService, but, as always, it depends on what you’re using it.

    Then, we create an anonymous object with the information of our interest and finally return them as an indented JSON.

    It’s time to run it! Open a terminal, navigate to the API project folder (in my case, SecretEndpoint), and run dotnet run. The application will compile and start; you can then navigate to /env and see the default result:

    The JSON result of the env endpoint

    How to change the Environment value

    While the applicationName does not change – it is the name of the running assembly, so any other value will make stop your application from running – you can (and, maybe, want to) change the Environment value.

    When running the application using the command line, you can use the --environment flag to specify the Environment value.

    So, running

    dotnet run --environment MySplendidCustomEnvironment
    

    will produce this result:

    MySplendidCustomEnvironment is now set as Environment

    There’s another way to set the environment: update the launchSettings.json and run the application using Visual Studio.

    To do that, open the launchSettings.json file and update the profile you are using by specifying the Environment name. In my case, the current profile section will be something like this:

    "profiles": {
    "SecretEntpoints": {
        "commandName": "Project",
        "dotnetRunMessages": true,
        "launchBrowser": true,
        "launchUrl": "swagger",
        "applicationUrl": "https://localhost:7218;http://localhost:5218",
        "environmentVariables":
            {
                "ASPNETCORE_ENVIRONMENT": "EnvByProfile"
            }
        },
    }
    

    As you can see, the ASPNETCORE_ENVIRONMENT variable is set to EnvByProfile.

    If you run the application using Visual Studio using that profile you will see the following result:

    EnvByProfile as defined in the launchSettings file

    How to list all the configurations in .NET APIs

    In my current company, we deploy applications using CI/CD pipelines.

    This means that final variables definition comes from the sum of 3 sources:

    • the project’s appsettings file
    • the release pipeline
    • the deployment environment

    You can easily understand how difficult it is to debug those applications without knowing the exact values for the configurations. That’s why I came up with these endpoints.

    To print all the configurations, we’re gonna use an approach similar to the one we’ve used in the previous example.

    The endpoint will look like this:

    app.MapGet("/conf", async context =>
    {
        IConfiguration? allConfig = context.RequestServices.GetRequiredService<IConfiguration>();
    
        IEnumerable<KeyValuePair<string, string>> configKv = allConfig.AsEnumerable();
    
        var jsonSerializerOptions = new JsonSerializerOptions { WriteIndented = true };
        await context.Response.WriteAsJsonAsync(configKv, jsonSerializerOptions);
    });
    

    What’s going on? We are retrieving the IConfiguration object, which contains all the configurations loaded at startup; then, we’re listing all the configurations as key-value pairs, and finally, we’re returning the list to the client.

    As an example, here’s my current appsettings.json file:

    {
      "ApiService": {
        "BaseUrl": "something",
        "MaxPage": 5,
        "NestedValues": {
          "Skip": 10,
          "Limit": 56
        }
      },
      "MyName": "Davide"
    }
    

    When I run the application and call the /conf endpoint, I will see the following result:

    Configurations printed as key-value pairs

    Notice how the structure of the configuration values changes. The value

    {
      "ApiService": {
        "NestedValues": {
          "Limit": 56
        }
    }
    

    is transformed into

    {
        "Key": "ApiService:NestedValues:Limit",
        "Value": "56"
    },
    

    That endpoint shows a lot more than you can imagine: take some time to have a look at those configurations – you’ll thank me later!

    How to change the value of a variable

    There are many ways to set the value of your variables.

    The most common one is by creating an environment-specific appsettings file that overrides some values.

    So, if your environment is called “EnvByProfile”, as we’ve defined in the previous example, the file will be named appsettings.EnvByProfile.json.

    There are actually some other ways to override application variables: we will learn them in the next article, so stay tuned! 😎

    3 ways to hide your endpoints from malicious eyes

    Ok then, we have our endpoints up and running, but they are visible to anyone who correctly guesses their addresses. And you don’t want to expose such sensitive info to malicious eyes, right?

    There are, at least, 3 simple values to hide those endpoints:

    • Use a non-guessable endpoint: you can use an existing word, such as “housekeeper”, use random letters, such as “lkfrmlvkpeo”, or use a Guid, such as “E8E9F141-6458-416E-8412-BCC1B43CCB24”;
    • Specify a key on query string: if that key is not found or it has an invalid value, return a 404-not found result
    • Use an HTTP header, and, again, return 404 if it is not valid.

    Both query strings and HTTP headers are available in the HttpContext object injected in the route definition.

    Now it’s your turn to find an appropriate way to hide these endpoints. How would you do that? Drop a comment below 📩

    Edit 2022-10-10: I thought it was quite obvious, but apparently it is not: these endpoints expose critical information about your applications and your infrastructure, so you should not expose them unless it is strictly necessary! If you have strong authentication in place, use it to secure those endpoints. If you don’t, hide those endpoints the best you can, and show only necessary data, and not everything. Strip out sensitive content. And, as soon as you don’t need that info anymore, remove those endpoints (comment them out or generate them only if a particular flag is set at compilation time). Another possible way is by using feature flags. In the end, take that example with a grain of salt: learn that you can expose them, but keep in mind that you should not expose them.

    Further readings

    We’ve used a quite new way to build and develop APIs with .NET, called “Minimal APIs”. You can read more here:

    🔗 Minimal APIs | Microsoft Learn

    If you are not using Minimal APIs, you still might want to create such endpoints. We’ve talked about accessing the HttpContext to get info about the HTTP headers and query string. When using Controllers, accessing the HttpContext requires some more steps. Here’s an article that you may find interesting:

    🔗 How to access the HttpContext in .NET API | Code4IT

    This article first appeared on Code4IT

    Wrapping up

    In this article, we’ve seen how two endpoints can help us with understanding the status of the deployments of our applications.

    It’s a simple trick that you can consider adding to your projects.

    Do you have some utility endpoints?

    Happy coding!

    🐧


    Source link