After the article for introduction to Graphs in Python, I have decided to put the graph theory into practice and start looking for the shortest points between points in a city. Parts of the code are inspired from the book Optimization Algorithms by Alaa Khamis, other parts are mine 🙂

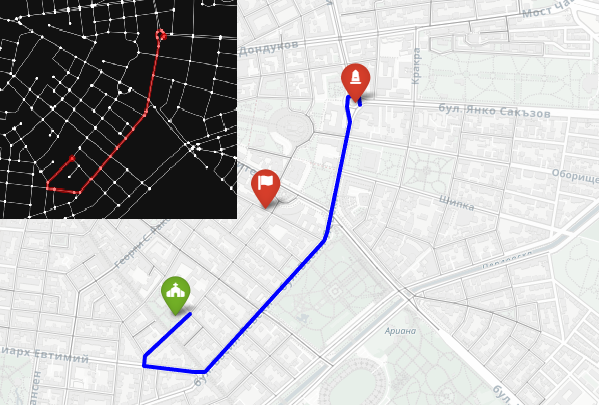
The idea is to go from the monument to the church with a car. The flag marks the middle, between the two points.
The solution uses several powerful Python libraries:
- OSMnx to download and work with real road networks from OpenStreetMap
- NetworkX to model the road system as a graph and calculate the shortest path using Dijkstra’s algorithm
- Folium for interactive map visualization
We start by geocoding the two landmarks to get their latitude and longitude. Then we build a drivable street network centered around the Levski Monument using ox.graph_from_address. After snapping both points to the nearest graph nodes, we compute the shortest route by distance. Finally, we visualize everything both in an interactive map and in a clean black-on-white static graph where the path is drawn in yellow.
|
|
import shutup shutup.please()
import pandas as pd import matplotlib.pyplot as plt import numpy as np
import networkx as nx import osmnx as ox import folium |
|
1 2 3 4 5 6 7 8 9 10 11 12 13 14 15 16 17 18 19 20
|
type_of_network = ‘drive’ start_point_name = “Monument Vasil Levski, Sofia, Bulgaria” end_point_name = “Sveti Sedmochislenitsi Church, Sofia, Bulgaria” start_point_geocode = ox.geocode(start_point_name) end_point_geocode = ox.geocode(end_point_name)
center_point = ( (start_point_geocode[0]+end_point_geocode[0]) /2, (start_point_geocode[1]+end_point_geocode[1])/2 ) graph = ox.graph_from_point(center_point, dist=1000, network_type=type_of_network) ox.plot_graph( graph, bgcolor = ‘yellow’, edge_color = ‘black’, node_color = ‘black’, edge_linewidth=1, node_size = 50, figsize=(10,10) ) |

Nodes and edges in radius of 1000 meters around the center point
|
1 2 3 4 5 6 7 8 9 10 11 12 13 14 15 16 17 18 19 20 21 22 23
|
origin_node = ox.distance.nearest_nodes(graph, start_point_geocode[1],start_point_geocode[0]) destination_node = ox.distance.nearest_nodes(graph, end_point_geocode[1],end_point_geocode[0])
fig, ax = ox.plot_graph( graph, bgcolor = ‘black’, edge_color = ‘white’, node_color = ‘white’, edge_linewidth=1, node_size = 50, show = False, close= False )
origin_xy = (graph.nodes[origin_node][‘x’],graph.nodes[origin_node][‘y’]) destination_xy = (graph.nodes[destination_node][‘x’],graph.nodes[destination_node][‘y’])
ax.scatter(*origin_xy, s=80, c=“red”, label = “Origin”, zorder = 3) ax.scatter(*destination_xy, s=80, c=“green”, label = “Destination”, zorder = 3)
ax.legend(facecolor = “white”) plt.title(“Graph with Origin (red) and Destination (green) nodes”) plt.show() |

Red and green are the nodes, that are the closest to the start and end points.
|
|
route = nx.shortest_path(graph, origin_node, destination_node, weight = ‘length’, method = ‘dijkstra’) route_length_meters = nx.shortest_path_length(graph, origin_node, destination_node, weight =‘length’, method = ‘dijkstra’) ox.plot_graph_route(graph, route) |

The closest driving route between the two points is in blue.
The full code is implemented in a Jupyter Notebook in GitHub and explained in the video.
https://www.youtube.com/watch?v=kQIK2P7erAA
GitHub link:
Enjoy the rest of your day! 🙂
دیدگاهتان را بنویسید